We conducted the 3rd annual Julia User & Developer Survey from June 2 – July 7, 2021. The results were presented by Andrew Claster during JuliaCon on July 29, 2021. Click here for the video presentation and slides.
2,660 Julia users and developers from more than 104 countries on six continents completed the survey. We recruited respondents online using Slack, Discourse, Twitter, LinkedIn, Facebook, email, JuliaLang.org and JuliaComputing.com. The survey was administered in 4 languages: English, Chinese, Japanese and Spanish.
Summary
Among Julia users and developers, Python is #2 after Julia. Python holds second-place behind Julia on several metrics: popularity, frequency of usage, and what Julia users would be using as their second choice if they weren’t using Julia.
The top reasons users and developers started using Julia include:
Julia seems like the language of the future (63%)
Elegance of Julia (53%)
Julia is faster (46%)
Julia solves the two language problem (44%)
Julia has preferable syntax compared to other languages (43%)
But the love for Julia extends beyond participants in the Julia User & Developer Survey. In the 2021 Stack Overflow Developer Survey, Julia ranked 5th out of 38 languages on ‘most loved languages’ - ahead of Python, Swift and Go.
Julia’s Most Popular Features and Biggest Problems
The most popular technical features of Julia are:
Speed, performance
Ease of use
Open source
Multiple dispatch
Package manager
Solves the two language problem
Composable
The most popular non-technical features of Julia are:
Free (You don’t have to pay to use it.)
Julia community
The biggest non-technical problems with Julia are related to adoption: too many colleagues, collaborators, employers and companies are still using other languages.
Packages: 74% of Julia users and developers say that the Julia package ecosystem is robust; just 14% say it is not robust.
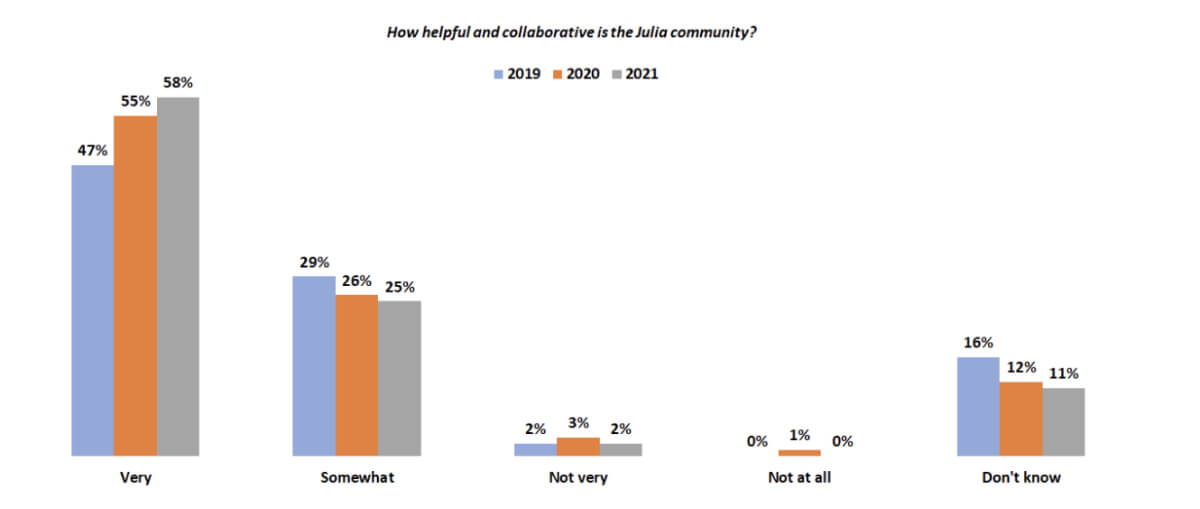
Julia Community: 83% of Julia users and developers say that the Julia community is very (58%) or somewhat (25%) helpful and collaborative. Only 2% say that the Julia community is not helpful and collaborative. The percentage of Julia users and developers who say the Julia community is ‘very’ helpful and collaborative has grown steadily from 47% in 2019 to 55% in 2020 and 58% in 2021.
Julia Community - Helpful and Collaborative
Source: Julia User & Developer Survey
Demographics
Academics and professionals: 61% of survey participants are academics while 43% are professionals (some respondents are both).
Among professionals, most are engineers or developers (71%), 44% are researchers, 22% are analysts and 12% are managers
The most popular fields for professionals include:
Software IT — 39%
Engineering — 23%
Finance — 12%
Life sciences, health care — 10%
Consulting — 9%
Government — 8%
Energy — 7%
Aerospace, aviation — 6%
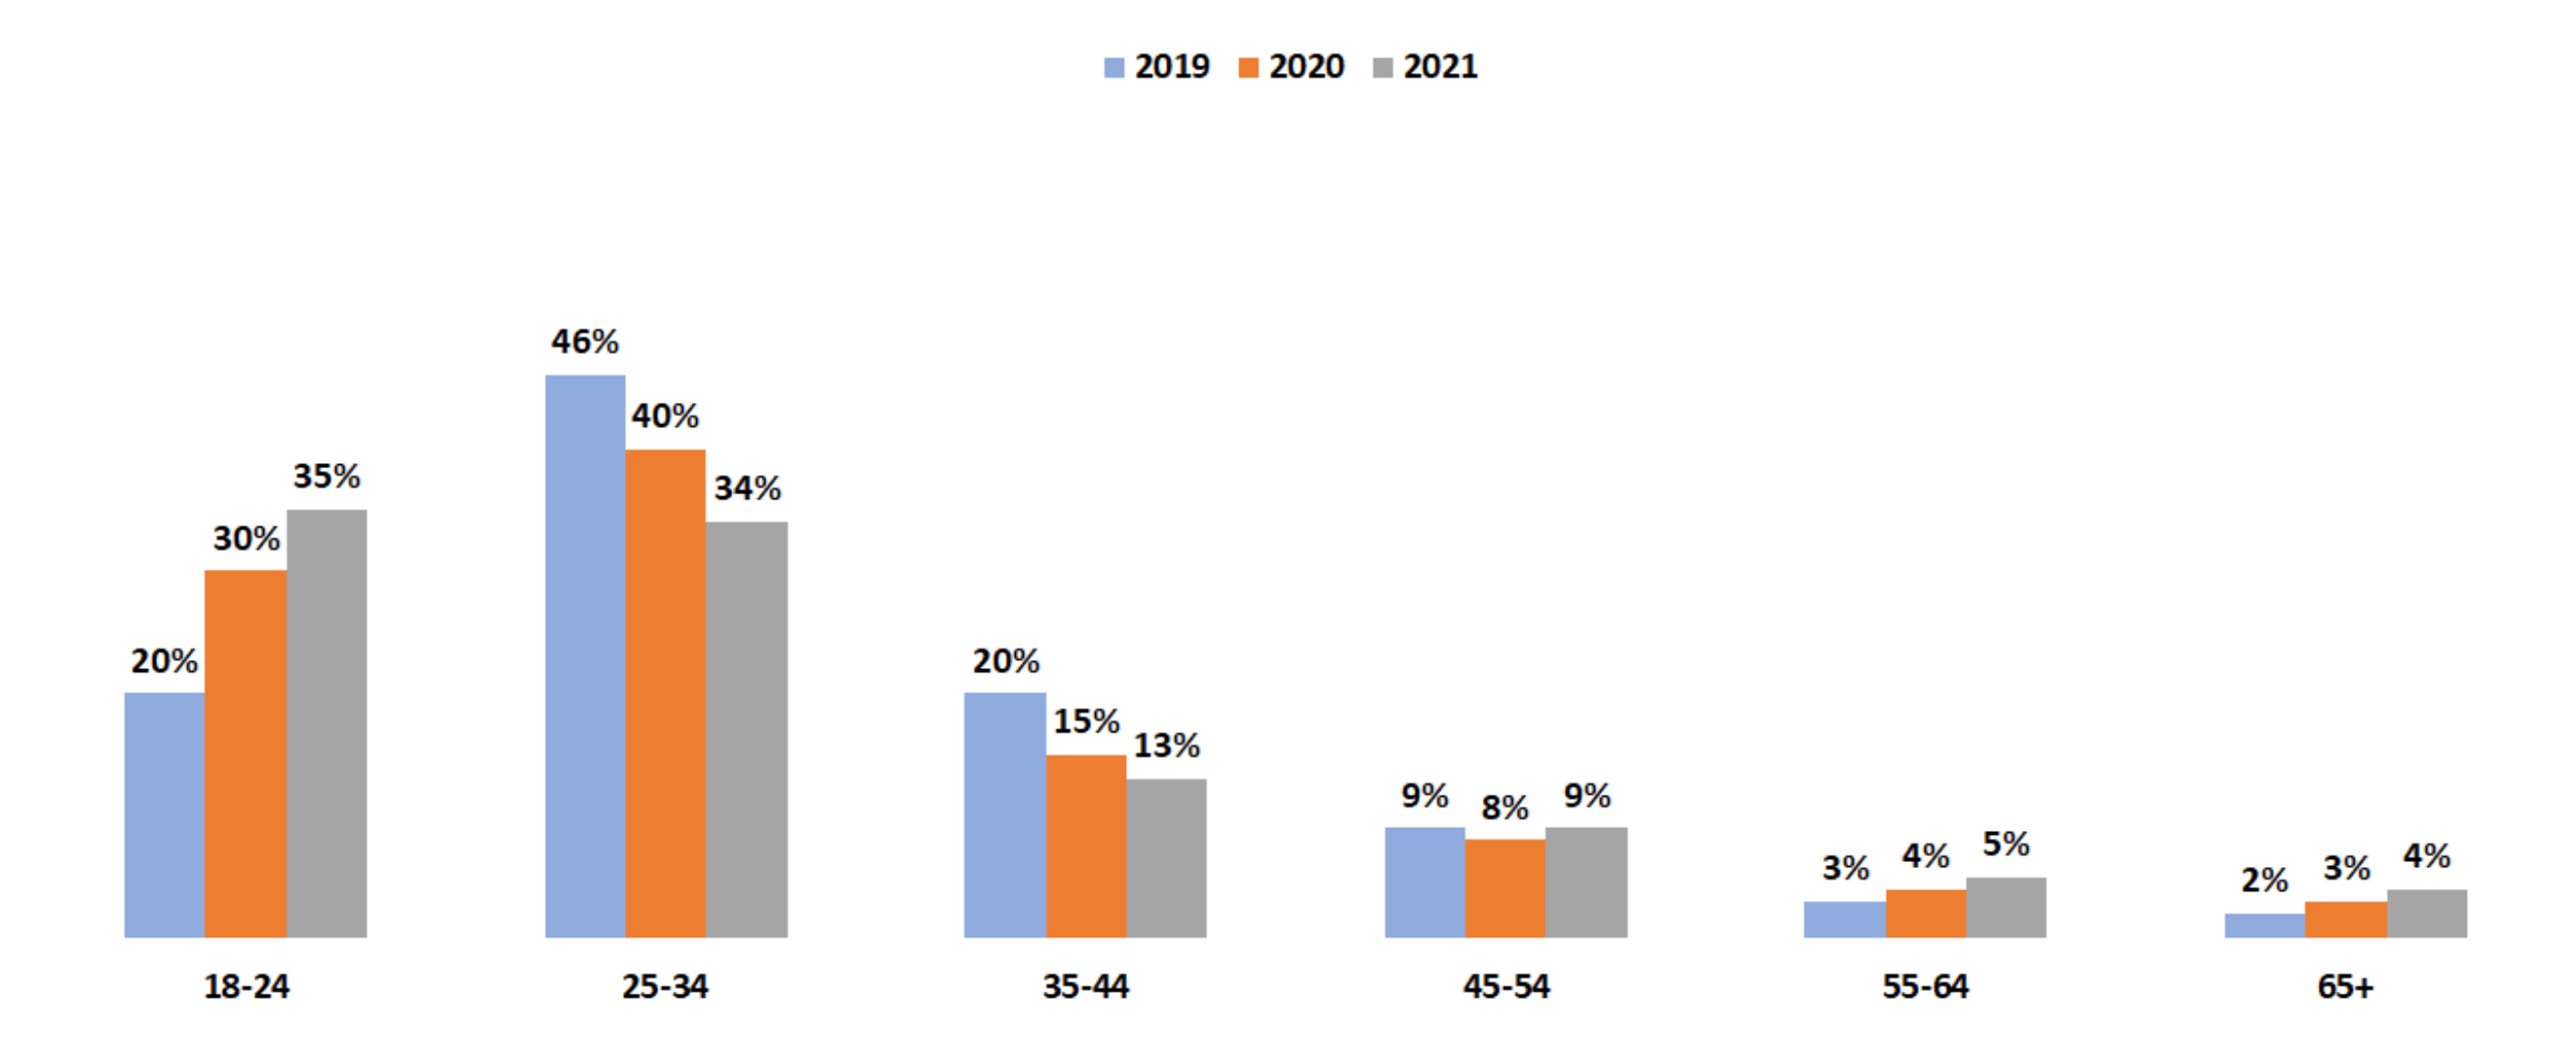
Age: According to Google Analytics, the age profile of visitors to docs.julialang.org has broadened and diversified considerably in just two years. Two years ago, 66% of visitors were age 25-44. Today, just 47% are. There has been growth both among younger visitors (aged 18-24 year-olds are up from 20% to 35% in just two years) and among older visitors (age 55+ have nearly doubled from 5% to 9% in two years).
Age of Visitors to Docs.JuliaLang.Org
Source: Google Analytics
Among survey respondents, the age distribution is 59% age 23-40 with 8% younger than 23 and 27% older than 40.
Country of origin and language: The survey was administered in 4 languages this year: English, Chinese, Japanese and Spanish. Respondents come from 104 countries and regions, including the US (21%), Germany (9%), China (8%), India (6%), France (5%), Brazil (4%) and the UK (3%). Respondents are fluent in 59 languages.
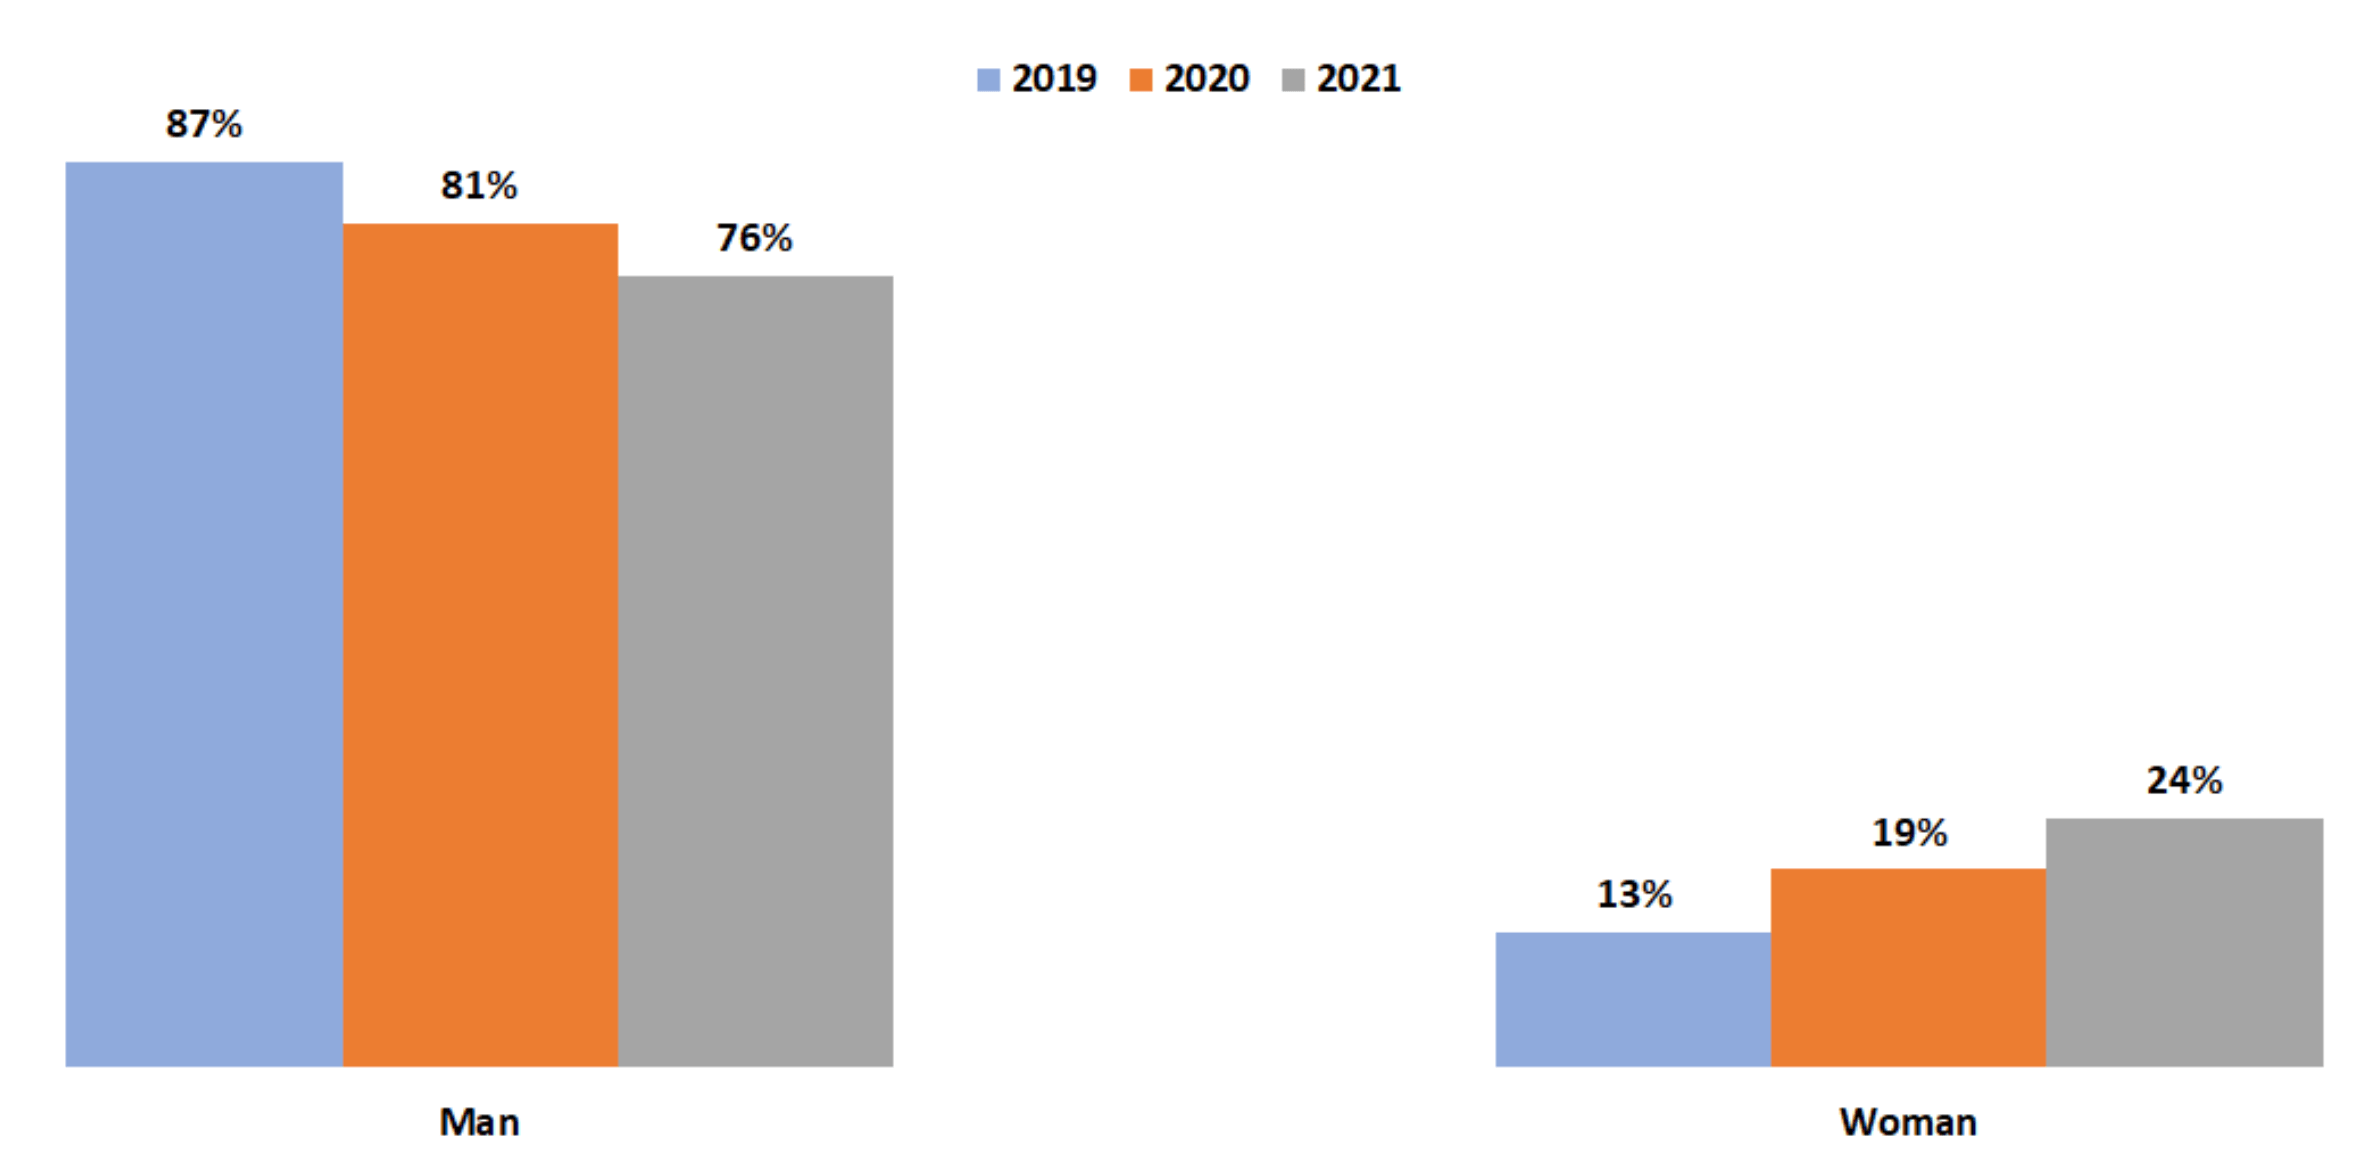
Gender: In just two years, women have nearly doubled their share of visitors to docs.julialang.org from 13% to 24%.
Gender of Visitors to Docs.JuliaLang.Org
Source: Google Analytics
Among survey respondents, 84% are men, 4% are women, 1% identify as non-binary and 11% declined to answer.