After 3 betas and 4 release candidates, Julia version 1.8 has finally been released. We would like to thank all the contributors to this release and all the testers that helped with finding regressions and issues in the pre-releases. Without you, this release would not have been possible.
The full list of changes can be found in the NEWS file, but here we'll give a more in-depth overview of some of the release highlights.
const on fields in mutable structs
Jameson Nash
Julia now supports annotating individual fields of a mutable struct with const annotations as:
mutable struct T
    x::Int
    const y::Float64
end
which causes the field y to be constant (and thus cannot be reassigned after creation of the type). This can be used to enforce invariants but the compiler can also take advantage of it to improve the generated code.
Call site @inline
Shuhei Kadowaki
Before Julia 1.8, the @inline macro could only be used on method definitions and the function would be inlined at all call sites of that method. However, it can be useful to make the choice for a given call site if a function should be inlined. Therefore, it is now possible to also apply the @inline macro to a given callsite as @inline f(x) which will tell the compiler to inline the method at that specific call.
Typed globals
Simeon Schaub
Non-constant global variables in Julia come with a performance penalty because the compiler cannot reason about their type since they during runtime can be reassigned to another object of some other type. In Julia 1.8, it is now possible to specify the type of a non-constant global variable using the x::T syntax where T is the type of the global. Trying to re-assign the variable to an object of another type errors:
julia> x::Int = 0
0

julia> x = "string"
ERROR: MethodError: Cannot `convert` an object of type String to an object of type Int64
...
Type annotating global variables removes much (but not all) of the cost of using non-constant global variables.
New default scheduler for @threads
Takafumi Arakaki, Ian Butterworth , Jeff Bezanson
Julia has had @threads macro for parallelizing a for loop even before the generic parallel task runtime was introduced in Julia 1.3. Due to this historical reason, @threads has been providing a static scheduling to avoid breaking programs accidentally relying on this strict behavior (see :static scheduling in the documentation). Thus, to work nicely with the rest of the multitasking system, the :static scheduler was introduced in Julia 1.5 to help people prepare for changing the default scheduling behavior in the future; which is now! In Julia 1.8, programs written with @threads can fully leverage the dynamic and composable task scheduler.
To illustrate the improvement, consider the following program that simulates CPU-intensive work-load that requires seconds seconds to complete:
julia> function busywait(seconds)
            tstart = time_ns()
            while (time_ns() - tstart) / 1e9 < seconds
            end
        end;
Before Julia 1.8, @threads always uses all worker threads. As such, @threads do not complete until all previous tasks are complete:
julia> @time begin
            Threads.@spawn busywait(5)
            Threads.@threads for i in 1:Threads.nthreads()
                busywait(1)
            end
        end
6.003001 seconds (16.33 k allocations: 899.255 KiB, 0.25% compilation time)
The run-time is about 6 seconds. It means that one task internally created for @threads waits for the task busywait(5) to complete.
However, in Julia 1.8, we have
julia> @time begin
            Threads.@spawn busywait(5)
            Threads.@threads for i in 1:Threads.nthreads()
                busywait(1)
            end
        end
2.012056 seconds (16.05 k allocations: 883.919 KiB, 0.66% compilation time)
It takes 2 seconds since one of the non-occupied threads can run two of the 1-second iterations to complete the for loop.
Profiling
New allocation profiler
Pete Vilter, Nathan Daly
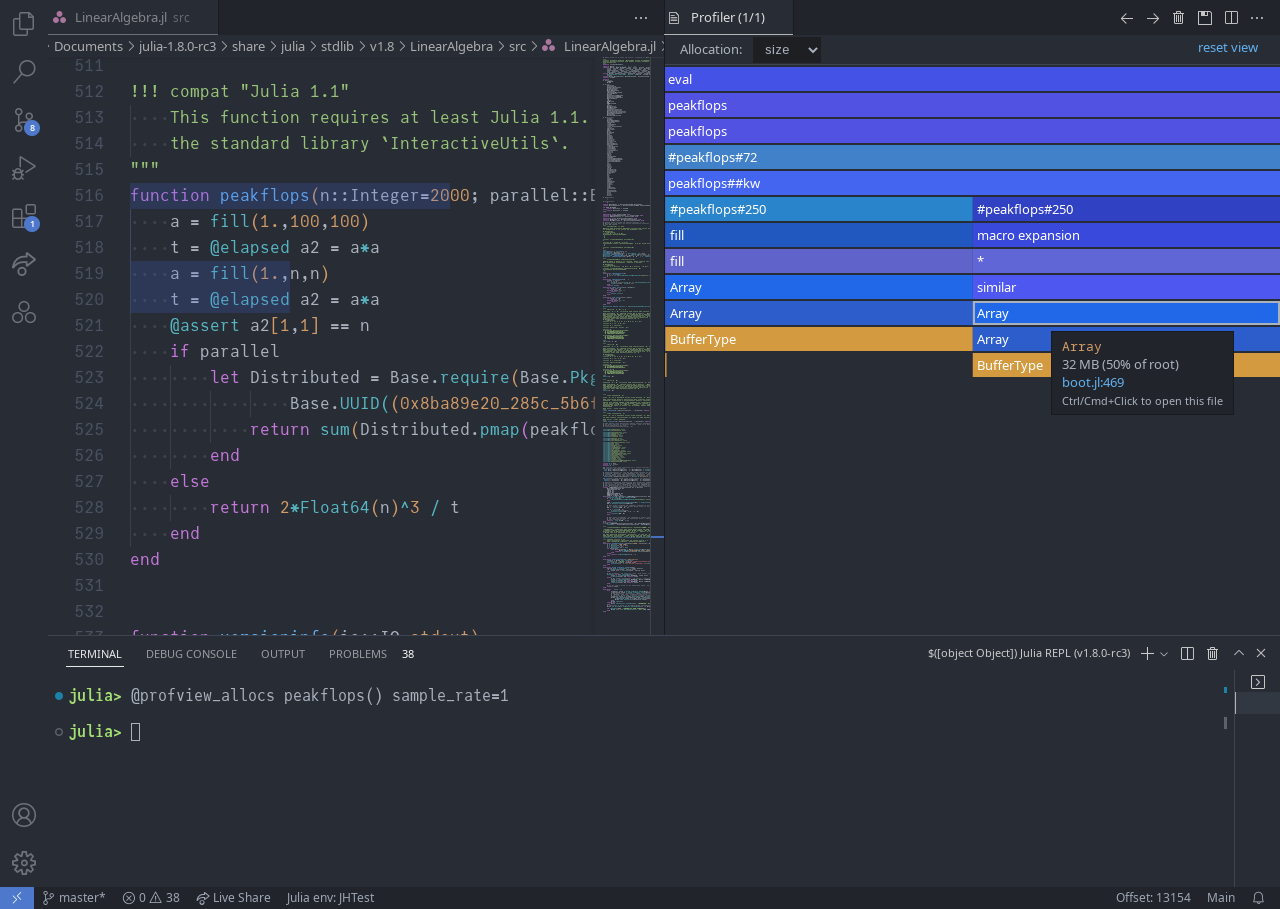
Unnecessary heap allocations can seriously degrade performance, and existing tools for tracking them down (namely @time and --track-allocation) didn't quite provide the fine-grained detail, nice visualization, and ease of use we were looking for. So we created the allocation profiler (Profile.Allocs), which captures heap allocations with the type, size, and stack trace of each, such that they can be easily visualized with PProf.jl and as seen below, with the Julia extension for VS Code.
 |
|---|
The Julia extension for VS Code provides easy access to illustrated allocation profiling via @profview_allocs |
Happy allocation hunting!
Updates to CPU profiling
Ian Butterworth
Thread & task profiling
CPU profiling is now collected with metadata for each sample, including thread id and task id, meaning that profiling reports can be generated for specific threads or tasks, or groups thereof.
julia> function myfunc()
           A = rand(200, 200, 400)
           maximum(A)
       end
myfunc (generic function with 1 method)

julia> myfunc() # run once to force compilation
0.9999999942189138

julia> @profile myfunc()
0.9999998811170847
The default print option remains the same, showing all threads and tasks grouped (stacktraces have been cut short for brevity)
julia> Profile.print()
Overhead ╎ [+additional indent] Count File:Line; Function
=========================================================
...
   ╎    ╎    ╎  70  REPL[13]:2; myfunc()
   ╎    ╎    ╎   70  ...lialang/julia-release-1-dot-8/usr/share/julia/stdlib/v1.8/Random/src/Random.jl:278; rand
                 ...
   ╎    ╎    ╎  16  REPL[13]:3; myfunc()
   ╎    ╎    ╎   16  @Base/reducedim.jl:994; maximum
                 ...
   ╎258 @Base/task.jl:634; task_done_hook(t::Task)
   ╎ 258 @Base/task.jl:930; wait()
258╎  258 @Base/task.jl:921; poptask(W::Base.InvasiveLinkedListSynchronized{Task})
Total snapshots: 344. Utilization: 25% across all threads and tasks. Use the `groupby` kwarg to break down by thread and/or task
Now using the groupby kwarg to group the samples by thread id (nthreads = 4)
julia> Profile.print(groupby=:thread)
Overhead ╎ [+additional indent] Count File:Line; Function
=========================================================
Thread 1 Total snapshots: 86. Utilization: 100%
...
  ╎    ╎    ╎  70 REPL[13]:2; myfunc()
  ╎    ╎    ╎   70 ...ulialang/julia-release-1-dot-8/usr/share/julia/stdlib/v1.8/Random/src/Random.jl:278; rand
                ...
  ╎    ╎    ╎  16 REPL[13]:3; myfunc()
  ╎    ╎    ╎   16 @Base/reducedim.jl:994; maximum
                ...

Thread 2 Total snapshots: 86. Utilization: 0%
  ╎86 @Base/task.jl:634; task_done_hook(t::Task)
  ╎ 86 @Base/task.jl:930; wait()
85╎  86 @Base/task.jl:921; poptask(W::Base.InvasiveLinkedListSynchronized{Task})

Thread 3 Total snapshots: 86. Utilization: 0%
  ╎86 @Base/task.jl:634; task_done_hook(t::Task)
  ╎ 86 @Base/task.jl:930; wait()
85╎  86 @Base/task.jl:921; poptask(W::Base.InvasiveLinkedListSynchronized{Task})

Thread 4 Total snapshots: 86. Utilization: 0%
  ╎86 @Base/task.jl:634; task_done_hook(t::Task)
  ╎ 86 @Base/task.jl:930; wait()
85╎  86 @Base/task.jl:921; poptask(W::Base.InvasiveLinkedListSynchronized{Task})
Note that each thread now shows a utilization percentage, showing that the only Julia thread that was notably active during the sampling was thread 1.
External profile viewers now also support thread and task selection.
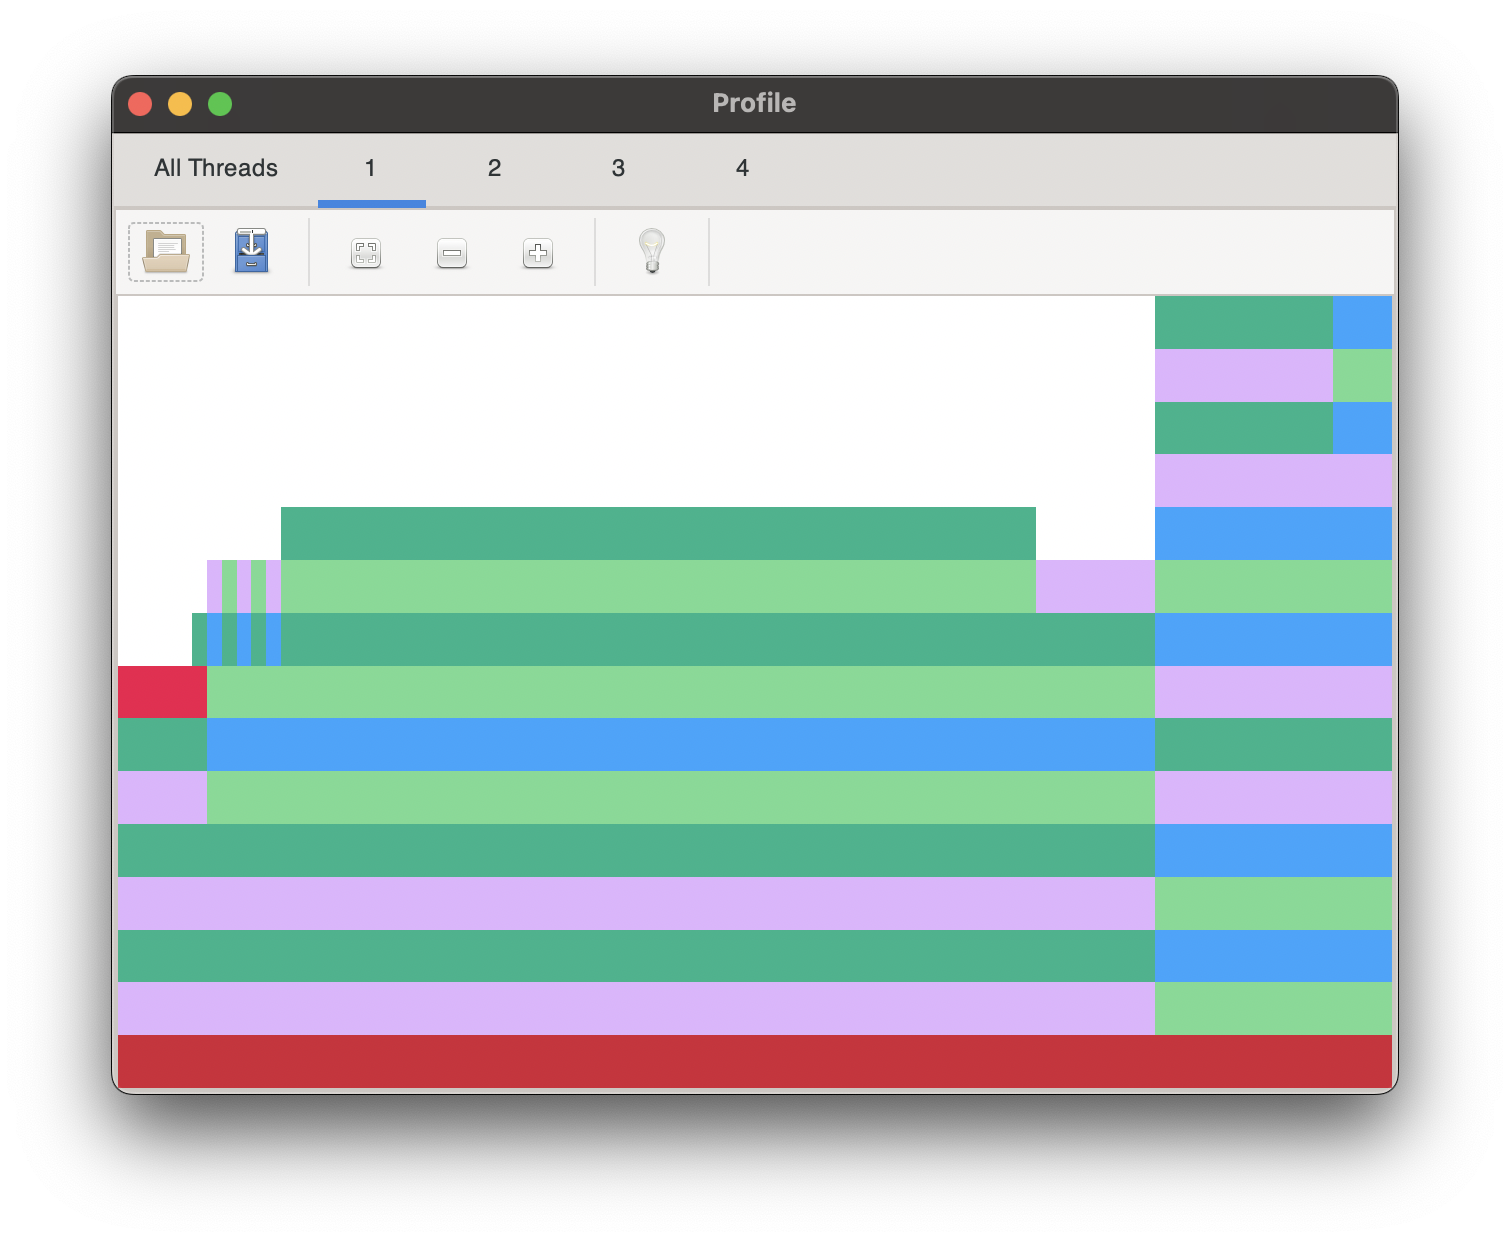 | 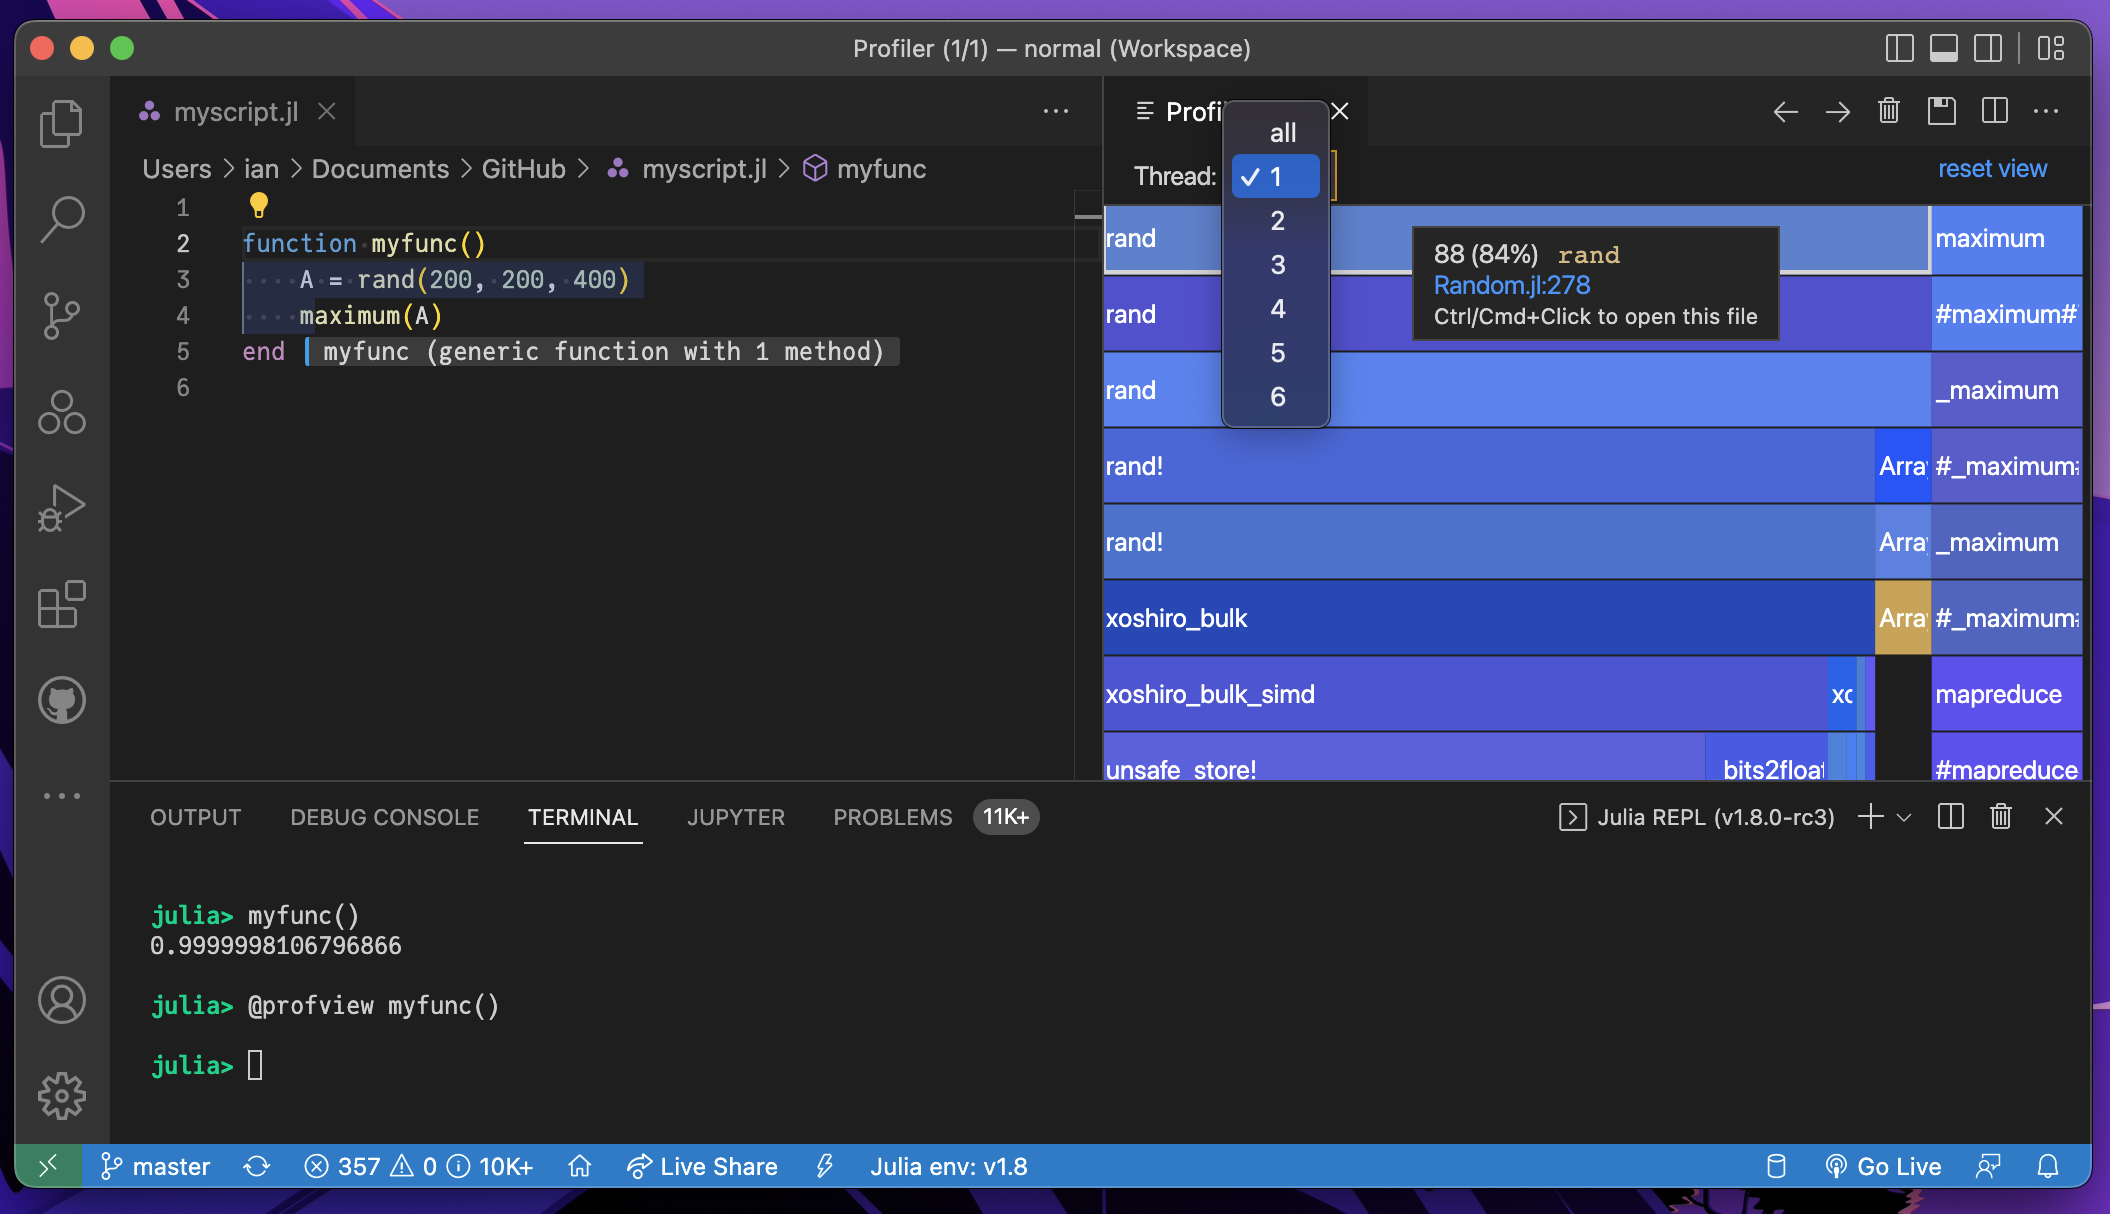 |
|---|---|
| ProfileView.jl | Julia extension for VS Code has a built-in @profview macro |
Profiling code that is already running
1.8 also introduces the option to profile code that is already running. Say you have started some long-running code and progress appears to slow. At any time you see what's happening without interrupting by triggering a 1-second profile via sending SIGINFO on BSDs including MacOS, or SIGUSR1 on Linux (not supported on Windows). MacOS & FreeBSD have the added convenience of sending SIGINFO via ctrl-t.
First, an immediate stacktrace will print, followed by the report after the profile sampling at the next yield point.
Here, the signal is sent shortly after executing the sleep. (stacktraces have been cut short for brevity)
julia> getpid()
123456

julia> sleep(5)
# hit ctrl-t on MacOS or FreeBSD
# or run `kill -s SIGUSR1 123456` for Linux, `kill -s SIGINFO 123456` for macOS/BSD in another terminal
load: 2.82  cmd: julia 32246 waiting 37.66u 8.33s

======================================================================================
Information request received. A stacktrace will print followed by a 1.0-second profile
======================================================================================

signal (29): Information request: 29
__psynch_cvwait at /usr/lib/system/libsystem_kernel.dylib (unknown line)
_pthread_cond_wait at /usr/lib/system/libsystem_pthread.dylib (unknown line)
uv_cond_wait at /Applications/Julia-1.8.app/Contents/Resources/julia/lib/julia/libjulia-internal.1.8.dylib (unknown line)
ijl_task_get_next at /Applications/Julia-1.8.app/Contents/Resources/julia/lib/julia/libjulia-internal.1.8.dylib (unknown line)
poptask at ./task.jl:921
wait at ./task.jl:930
...

==============================================================
Profile collected. A report will print at the next yield point
==============================================================

Overhead ╎ [+additional indent] Count File:Line; Function
=========================================================
Thread 1 Task 0x000000010944c010 Total snapshots: 650. Utilization: 0%
...
   ╎    ╎    ╎  650 @Base/asyncevent.jl:240; sleep(sec::Int64)
                ...

Thread 2 Task 0x00000001095487f0 Total snapshots: 650. Utilization: 0%
   ╎650 @Base/task.jl:634; task_done_hook(t::Task)
   ╎ 650 @Base/task.jl:930; wait()
649╎  650 @Base/task.jl:921; poptask(W::Base.InvasiveLinkedListSynchronized{Task})

Thread 3 Task 0x000000010944c550 Total snapshots: 650. Utilization: 0%
...
   ╎     650 @Base/task.jl:930; wait()
649╎    ╎ 650 @Base/task.jl:921; poptask(W::Base.InvasiveLinkedListSynchronized{Task})

Thread 4 Task 0x00000001095486a0 Total snapshots: 650. Utilization: 0%
   ╎650 @Base/task.jl:634; task_done_hook(t::Task)
   ╎ 650 @Base/task.jl:930; wait()
649╎  650 @Base/task.jl:921; poptask(W::Base.InvasiveLinkedListSynchronized{Task})
Packages
Package load timing
Ian Butterworth
A new tool has been added to provide insight into the way that loading dependencies contribute to the load time of a package.
The macro is InteractiveUtils.@time_imports and it is directly available in the REPL.
julia> @time_imports using CSV
     50.7 ms  Parsers 17.52% compilation time
      0.2 ms  DataValueInterfaces
      1.6 ms  DataAPI
      0.1 ms  IteratorInterfaceExtensions
      0.1 ms  TableTraits
     17.5 ms  Tables
     26.8 ms  PooledArrays
    193.7 ms  SentinelArrays 75.12% compilation time
      8.6 ms  InlineStrings
     20.3 ms  WeakRefStrings
      2.0 ms  TranscodingStreams
      1.4 ms  Zlib_jll
      1.8 ms  CodecZlib
      0.8 ms  Compat
     13.1 ms  FilePathsBase 28.39% compilation time
   1681.2 ms  CSV 92.40% compilation time
Any compilation time will be highlighted as a percentage of load time, and if any of that compile time is re-compiling invalidated methods, that will be highlighted as a percentage of compile time.
Pkg status update with upgradable package indicator
Ian Butterworth, Kristoffer Carlsson
Packages in Julia tend to declare compatibility constraints on versions of their dependencies. This is done to ensure that you end up with a set of versions that should work well with each other. However, this means that sometimes the package manager might not give you the very latest version of all packages. Another reason why you might not have the latest version of a package is when new versions have been released since you last updated. This can sometimes be confusing when you for example hit a bug that has been fixed on a later version or when the documentation of the package is not in sync with what you are running locally.
Therefore, the package manager will now show a small indicator when installing packages or when using the status output (pkg> st) for packages that are not on the latest version. It will also try to predict if the package has a chance to be updated (pkg> up) or if some other packages in your environment are "holding it back" (have compatibility constraints that prevent the package from updating).
There is also a new flag --outdated that can be passed to the status printing to see what the latest versions are and what packages' compat is holding other packages back from updating.
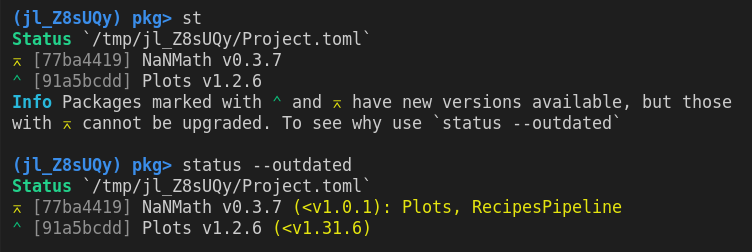
Above, we can see that both Plots and NanMath are not on their latest version and Plots and RecipesPipeline are blocking NanMath from upgrading.
Pkg support for sysimages
Kristoffer Carlsson
Using the package PackageCompiler.jl it is possible to create a "sysimage" (a prebaked serialized file) with packages that can significantly improve the load time of these packages. A drawback to this is that when using a custom sysimage with packages, the version of those packages are "frozen" so that no matter what package version is installed in your environment, you will still end up loading the version that is in the sysimage. Explicitly, if you have version 0.1 of a package in the sysimage and you add version 0.2 with the package manager, you will still use version 0.1.
In 1.8, the package manager understands when a custom sysimage is used and will not install packages for you at different versions than what is in the loaded sysimage.
Improved precompilation
Tim Holy
Julia precompiles packages by saving your module definitions in a second format (cache files with extension .ji) that can be loaded more quickly than the raw source files. These cache files include the modules, types, methods, global variables, and other objects in the package. To reduce the time for first execution of package methods, developers have long had the option to also save some of the outcomes of type-inference: one can add explicit precompile directives or insert a small workload that triggers compilation of the methods.
Unfortunately, older Julia versions ended up throwing away a lot of this compiled code: type-inferred code was saved only for methods defined in the package, and for all other methods it was discarded. This meant that if your package needed a method in Base or another package that had not previously been inferred for the specific types needed by your package, you were out of luck–that method/type combination would always be freshly re-inferred in each new Julia session. Moreover, precompilation occasionally triggered a runtime performance hit: when Julia's compiler needed type-inferred code that had been discarded, it handled the omission by inserting an indirect invocation into the low-level CPU instructions that it compiles for your method. While this provided an opportunity to re-infer the methods for the required types, the indirect invocation allocated memory and reduced performance for all subsequent uses of the method.
Julia 1.8 addresses both of these limitations by automatically saving all type-inferred code that links back to your package: either methods owned by your package or any newly-inferred code that can be proven by the compiler to be called by methods in your package. More specifically, all code that is linked to your package by a chain of successful type-inference will be cached; Julia only discards type-inference results for methods in other packages that were only called by runtime dispatch. This inference-chain requirement ensures that compilation that is performed to build your package, but which is not needed to run it (e.g., code used only for metaprogramming or generating data), does not unnecessarily bloat the .ji files.
With Julia 1.8, for workloads with "predictable" types, you can often entirely eliminate type-inference as a source of latency. The amount of savings depends on how much of the overall latency was due to type-inference; in tests with a dozen or so different packages, we have observed reductions in the time for an initial workload ranging from a few percent to 20-fold. Users of SnoopCompile's analysis tools will also find that the results of adding precompilation are much more predictable: for dispatch-trees that trace back to methods owned by your package, adding precompilation will eliminate all of their inference time. Thus, you can eliminate the worst offenders with the confidence that your intervention will have the intended effect.
For those wishing for more background about precompilation, this blog post and/or the SnoopCompile documentation may be useful.
Improved support for Apple Silicon
Previously Julia 1.7 offered the first experimental preview of native builds of Julia on Apple Silicon. While this generally worked for basic usage, users experienced frequent segmentation faults, negatively affecting the experience. These problems were due to how Julia internally uses LLVM to generate and link the code for this platform and were eventually solved in Julia 1.8 by moving to a more modern linker, which has better support for ARM CPUs on macOS. However, this fix required upgrading to LLVM 13, a change which cannot be backported to the v1.7 series. Therefore 1.7 will always be affected by frequent crashes on Apple Silicon.
With 1.8, Apple Silicon becomes become a Tier 2 supported platform and is now covered by Continuous Integration (CI) on dedicated Apple Silicon machines.