Julia Micro-Benchmarks
These micro-benchmarks, while not comprehensive, do test compiler performance on a range of common code patterns, such as function calls, string parsing, sorting, numerical loops, random number generation, recursion, and array operations.
The results below were taken from the Microbenchmarks site, which is regenerated automatically and always has the most up to date numbers.
It is important to note that the benchmark codes are not written for absolute maximal performance (the fastest code to compute recursion_fibonacci(20) is the constant literal 6765). Instead, the benchmarks are written to test the performance of identical algorithms and code patterns implemented in each language. For example, the Fibonacci benchmarks all use the same (inefficient) doubly-recursive algorithm, and the pi summation benchmarks use the same for-loop. The “algorithm” for matrix multiplication is to call the most obvious built-in/standard random-number and matmul routines (or to directly call BLAS if the language does not provide a high-level matmul), except where a matmul/BLAS call is not possible (such as in JavaScript).
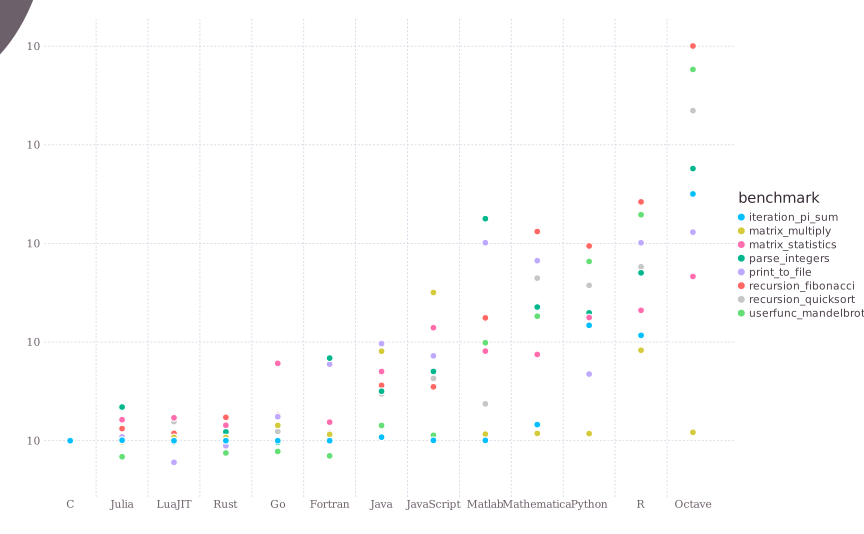
Note that the Julia results depicted above do not include compile time.
The vertical axis shows each benchmark time normalized against the C implementation (log scale, lower is better), with one dot per benchmark and language. The benchmark data shown above were computed with Julia v1.13.2, Rust 1.99.1, Go 1.24.13, Numba 0.68.0, LuaJIT 2.1.1703358377, Scala 3.3.4, Java 24.0.2, Swift 6.1.3, JavaScript V8 13.6.233.17 (Node.js), Python 3.13.16, R 4.5.1, and Octave 8.4.0. C and Fortran are compiled with gcc 13.3.0. Julia, C, Fortran, Numba, Python, Go, Java, Rust, Scala, R, Octave, and Swift call an optimized BLAS library for matrix operations (for example OpenBLAS, through NumPy for Python and Numba, Gonum for Go, jBLAS for Java, ndarray for Rust, Breeze for Scala, and Accelerate for Swift), while the JavaScript and LuaJIT matrix multiplications are pure implementations. The matrix_statistics benchmark works on small 5×5 matrices and therefore depends less on BLAS. Raw benchmark numbers in CSV format are available here and the benchmark source code for each language can be found in the Microbenchmarks repository. The plot above recreates the one on the Microbenchmarks site from that CSV file.
These micro-benchmark results were obtained in single-threaded mode on GitHub Actions ubuntu-latest (x86_64) runners. Each benchmark is run 5 times in-process and the minimum time is kept; the whole suite is run 3 times and the best of the up to 15 measurements is reported. Julia and Numba perform a warm-up pass first so that compilation time is excluded. See the methodology notes for details.
Time relative to C
Each cell is the benchmark time divided by the C time for the same benchmark (lower is better). There is no JavaScript implementation of userfunc_mandelbrot.
| Benchmark | C | Julia | Rust | Go | Fortran | Numba | LuaJIT | Scala | Java | Swift | JavaScript | Python | R | Octave |
|---|---|---|---|---|---|---|---|---|---|---|---|---|---|---|
iteration_pi_sum | 1.00 | 0.77 | 0.79 | 0.33 | 0.87 | 0.58 | 0.87 | 0.88 | 0.80 | 0.70 | 0.89 | 47.32 | 22.34 | 400.69 |
recursion_fibonacci | 1.00 | 2.79 | 2.18 | 2.03 | 0.71 | 1.90 | 3.21 | 2.10 | 3.57 | 2.21 | 6.05 | 66.09 | 477.63 | 5256.18 |
recursion_quicksort | 1.00 | 0.81 | 0.82 | 0.80 | 1.05 | 0.81 | 2.00 | 1.64 | 1.91 | 4.71 | 2.21 | 35.15 | 47.87 | 619.73 |
parse_integers | 1.00 | 0.88 | 0.57 | 0.84 | 0.70 | 6.54 | 1.23 | 3.96 | 2.40 | 5.30 | 2.39 | 11.84 | 25.21 | 231.65 |
print_to_file | 1.00 | 1.14 | 0.46 | 0.93 | 7.16 | 2.54 | 0.83 | 1.40 | 5.93 | 4.55 | 9.67 | 5.12 | 113.00 | 54.82 |
matrix_statistics | 1.00 | 0.94 | 0.62 | 3.85 | 1.46 | 4.50 | 2.09 | 5.62 | 3.66 | 22.49 | 12.48 | 9.50 | 12.94 | 19.03 |
matrix_multiply | 1.00 | 0.73 | 0.96 | 3.89 | 1.06 | 0.50 | 1.10 | 1.37 | 3.15 | 11.87 | 22.18 | 1.05 | 1.29 | 1.07 |
userfunc_mandelbrot | 1.00 | 0.79 | 0.91 | 0.68 | 0.90 | 0.64 | 2.31 | 2.28 | 1.99 | 0.78 | — | 77.17 | 236.30 | 3269.18 |