A few months ago on this blog, I introduced a new Julia feature that lets users easily submit bugreports using the rr time-traveling debugger (please go read that post if you haven't, otherwise the rest of this post may not make much sense). Since Julia 1.5 was officially released a little over a month ago, more than a dozen users have made use of this capability to send us detailed bug reports. So far, everything went according to plan.

In this post I want to tell the story of issue #37524, the most unusual of the several rr traces we received. As spoiled in the title of this blog post, the eventual issue turned out to be faulty memory. However, by popular demand, and to dispel any rumors of the use of black magic, I thought it might be worth stepping through the analysis of this issue step by step.
When debugging an rr trace, the first thing to do is usually to just replay it to the point of the crash to look around (sometimes the crash is obvious from the state of the program at the crash location, other times, more history is required). In this case the initial investigation was done by my colleague Tim Besard. Downloading the trace and starting the replay he would have seen the following. Note that this recording is sped up about 20x (it runs for about two minutes real time) and lightly edited at the end to focus on only the relevant output.
So clearly the user who submitted the bug report was doing some sort of episodic procedure (maybe an ML training process), and a couple thousand iterations in, something went wrong. The issue reported the following output:
signal (11): Segmentation fault
in expression starting at julia-crash.jl:76
jl_is_concrete_type at /buildworker/worker/package_linux64/build/src/julia.h:1222 [inlined]
jl_apply_tuple_type_v_ at /buildworker/worker/package_linux64/build/src/jltypes.c:1381 [inlined]
jl_apply_tuple_type at /buildworker/worker/package_linux64/build/src/jltypes.c:1389
arg_type_tuple at /buildworker/worker/package_linux64/build/src/gf.c:1853
jl_lookup_generic_ at /buildworker/worker/package_linux64/build/src/gf.c:2361 [inlined]
jl_apply_generic at /buildworker/worker/package_linux64/build/src/gf.c:2394
jl_apply at /buildworker/worker/package_linux64/build/src/julia.h:1690 [inlined]
do_apply at /buildworker/worker/package_linux64/build/src/builtins.c:655
update! at Knn2.jl:48
update! at Knn2.jl:106
unknown function (ip: 0x7f0483dd8205)
[snip]
but instead, we get an internal rr error:
[FATAL /home/keno/rr/src/ReplaySession.cc:636:check_pending_sig()]
 (task 17107 (rec:7760) at time 51911)
 -> Assertion `false' failed to hold. Replaying `SIGNAL: SIGSEGV(det)': expecting tracee signal or trap, but instead at
 `write' (ticks: 144040993972)
Tail of trace dump:
[snip]
  { syscall:'clock_gettime', ret:0x0, size:0x20 }
}
{
  real_time:38257.585221 global_time:51911, event:`SIGNAL: SIGSEGV(det)' tid:7760, ticks:143998759917
rax:0x436487c0 rbx:0x7f0490b74330 rcx:0xb479 rdx:0x435f2dc8 rsi:0x435f2dc0 rdi:0x435f2dc0 rbp:0x7fff6ca71250 rsp:0x7fff
6ca71230 r8:0x1 r9:0x7f0490b74330 r10:0x1007f0490b784d0 r11:0x4364d190 r12:0x0 r13:0x7f0490b88c70 r14:0x7f047daf36d0 r1
5:0xb479 rip:0x7f049e2ba8e3 eflags:0x10287 cs:0x33 ss:0x2b ds:0x0 es:0x0 fs:0x0 gs:0x0 orig_rax:0xffffffffffffffff fs_b
ase:0x7f0499f49240 gs_base:0x0
}
{
  real_time:38257.585223 global_time:51912, event:`SYSCALLBUF_RESET' tid:7760, ticks:143998759917
}
This is the point where Tim asked me to take over, since that really isn't supposed to happen. Now, the error message here may look a bit scary, but let's parse it out part by part. The actual error message is:
Replaying `SIGNAL: SIGSEGV(det)': expecting tracee signal or trap, but instead at
 `write' (ticks: 144040993972)
What does this mean? First a quick refresher about how rr works: Basically, it records any modifications made to the process memory by the kernel (or any other source of non-determinism). Then, between such modification it relies on the determinism of the processor to produce a bitwise-identical output state, given an input memory state. At each event rr also records the complete incoming and outgoing register state. The incoming register state is not strictly required (since it will be deterministically computed from the previous input state), but it can be useful for some analyses purposes, as well as allowing an additional check that replay is proceeding correctly.
Now, what happened here is that rr expected to get a deterministic ((det)) segfault (i.e. one caused by the execution of an instruction, as opposed to being asynchronously sent by some other process e.g. using kill -SIGSEGV). However, instead of seeing this segfault, we ended up somewhere else: but instead at
'write'. During the replay, rr found itself being told to execute a write system call rather than seeing the crash. We've already seen the output behavior of the program (basically one write for every episode), so a reasonable guess is that during replay, it instead successfully finished the episode and reached the next write system call (which would have been the first execution point at which the rr supervisor regains control from the tracee). In rr parlance, we call this a "divergence": A situation in which the execution path taken during replay differs from what actually happened during recording. Divergences are generally caused by rr bugs resulting in unobserved memory modifications (e.g. an imperfect model of the kernel's memory modification behavior), but there are more subtle issues that may be responsible as well (such as CPU microarchitecture bugs). I thus turned to trying to debug this divergence. There are a few common candidates for divergences that I looked for first. In no particular order of preference, they are:
Unusual system calls that may not have gotten enough testing in rr, thus making it likely that rr's model of the kernel behavior is incomplete
Unusual or proprietary devices/device drivers/kernel extensions that may be silently modifying userspace memory (a big no-no, and probably a security issue, but surprisingly many bad drivers do it anyway).
Unusual CPUs or microarchitectures that may not have been tested before (e.g. old Silvermont Atom chips are known to have such microarchitecture bugs).
However, looking through the raw trace (the event log obtained using rr dump) and asking for hardware details, nothing particularly suspicious came to mind, so I set to analyzing the trace itself. In the listing above, I snipped out the events before the segfaults, but here they are for reference, so we can talk about them a bit:
{
  real_time:38257.562367 global_time:51903, event:`SYSCALL: write' (state:ENTERING_SYSCALL) tid:7760, ticks:143983372177
rax:0xffffffffffffffda rbx:0x681fffa0 rcx:0xffffffffffffffff rdx:0x4 rsi:0x7f046a9a0338 rdi:0xd rbp:0xd rsp:0x681ffe10 r8:0x0 r9:0x7f0490095f90 r10:0x7f0475ad7bb0 r11:0x246 r12:0x0 r13:0x7f046a9a0338 r14:0x4 r15:0x7f046a9a0338 rip:0x70000002 eflags:0x246 cs:0x33 ss:0x2b ds:0x0 es:0x0 fs:0x0 gs:0x0 orig_rax:0x1 fs_base:0x7f0499f49240 gs_base:0x0
}
{
  real_time:38257.562369 global_time:51904, event:`SYSCALLBUF_RESET' tid:7760, ticks:143983372177
}
{
  real_time:38257.562395 global_time:51905, event:`SYSCALL: write' (state:EXITING_SYSCALL) tid:7760, ticks:143983372177
rax:0x4 rbx:0x681fffa0 rcx:0xffffffffffffffff rdx:0x4 rsi:0x7f046a9a0338 rdi:0xd rbp:0xd rsp:0x681ffe10 r8:0x0 r9:0x7f0490095f90 r10:0x7f0475ad7bb0 r11:0x246 r12:0x0 r13:0x7f046a9a0338 r14:0x4 r15:0x7f046a9a0338 rip:0x70000002 eflags:0x246 cs:0x33 ss:0x2b ds:0x0 es:0x0 fs:0x0 gs:0x0 orig_rax:0x1 fs_base:0x7f0499f49240 gs_base:0x0
}
{
  real_time:38257.562444 global_time:51906, event:`SYSCALLBUF_FLUSH' tid:7760, ticks:143983372944
{
  real_time:38257.562448 global_time:51907, event:`SYSCALL: write' (state:ENTERING_SYSCALL) tid:7760, ticks:143983372944
rax:0xffffffffffffffda rbx:0x681fffa0 rcx:0xffffffffffffffff rdx:0x1 rsi:0x7f047ba39840 rdi:0xd rbp:0xd rsp:0x681ffe10 r8:0x0 r9:0x7f0490095f90 r10:0x7f0475ad7bb0 r11:0x246 r12:0x0 r13:0x7f047ba39840 r14:0x1 r15:0x7f047ba39840 rip:0x70000002 eflags:0x246 cs:0x33 ss:0x2b ds:0x0 es:0x0 fs:0x0 gs:0x0 orig_rax:0x1 fs_base:0x7f0499f49240 gs_base:0x0
}
{
  real_time:38257.562449 global_time:51908, event:`SYSCALLBUF_RESET' tid:7760, ticks:143983372944
}
{
  real_time:38257.562475 global_time:51909, event:`SYSCALL: write' (state:EXITING_SYSCALL) tid:7760, ticks:143983372944
rax:0x1 rbx:0x681fffa0 rcx:0xffffffffffffffff rdx:0x1 rsi:0x7f047ba39840 rdi:0xd rbp:0xd rsp:0x681ffe10 r8:0x0 r9:0x7f0490095f90 r10:0x7f0475ad7bb0 r11:0x246 r12:0x0 r13:0x7f047ba39840 r14:0x1 r15:0x7f047ba39840 rip:0x70000002 eflags:0x246 cs:0x33 ss:0x2b ds:0x0 es:0x0 fs:0x0 gs:0x0 orig_rax:0x1 fs_base:0x7f0499f49240 gs_base:0x0
}
{
  real_time:38257.585211 global_time:51910, event:`SYSCALLBUF_FLUSH' tid:7760, ticks:143998759917
}
{
  real_time:38257.585221 global_time:51911, event:`SIGNAL: SIGSEGV(det)' tid:7760, ticks:143998759917
rax:0x436487c0 rbx:0x7f0490b74330 rcx:0xb479 rdx:0x435f2dc8 rsi:0x435f2dc0 rdi:0x435f2dc0 rbp:0x7fff6ca71250 rsp:0x7fff
6ca71230 r8:0x1 r9:0x7f0490b74330 r10:0x1007f0490b784d0 r11:0x4364d190 r12:0x0 r13:0x7f0490b88c70 r14:0x7f047daf36d0 r1
5:0xb479 rip:0x7f049e2ba8e3 eflags:0x10287 cs:0x33 ss:0x2b ds:0x0 es:0x0 fs:0x0 gs:0x0 orig_rax:0xffffffffffffffff fs_b
ase:0x7f0499f49240 gs_base:0x0
}
Let's start with explaining some terminology. While rr does keep track of elapsed wall clock time (real_time above), that notion of "time" is entirely informational. Instead, rather than dividing time into hours, seconds and minutes, rr divides time into events, tid (the kernel's thread id for each task; in circumstances where ids are reused an additional serial counter is computed, but not saved) and ticks. events are a global (over the tree of recorded processes) linear ordering of events that cause external modification to the process' memory (e.g. system calls or signals), whereas ticks are a per-task (think per-thread or per-tid) measure of forward progress. The exact metric depends on the CPU microarchitecture and what measurement hardware is available. Valid choices are e.g. Number of retired instructions or Number of retired conditional branches, but in theory any stable, reliable count of forward progress is sufficient, as long as it uniquely identifies (potentially in conjunction with the register state) a particular point in the execution (e.g. number of retired instructions works trivially and retired conditional branches mostly work, because that count in conjunction with the instruction pointer forms a monotonically increasing pair).
Alright, so looking at the event log, we basically see reflected what we already knew: It does a bunch of write system calls (to print the episode number), a ton of computation (143 billion conditional branches' worth), and eventually it's supposed to crash. We also know that at event 51909 (the last write before the supposed segfault), things in the replay were still mostly on track. We can't say whether the memory contents had already diverged, but we at least know that the register state and the number of instructions executed was bitwise identical to what happened during the recording.
One good way to investigate a divergence is to poke around in memory a bit prior to when one suspects the divergence to have occurred and see what kind of memory modifications could have made the difference. Usually, I just do this by going to the prior event, but in our case, there are 15 million conditional branches between the last two events, which is quite a bit of distance. Instead I hacked up a quick command that lets us seek directly to a particular tick count. In this case, I arbitrarily chose 143998750000, about 10000 ticks prior to when the segfault occurred during the recording. Let's go there:
$ rr replay -g 51908 --serve-files .
[snip]
0x0000000070000002 in ?? ()
(rr) when
Current event: 51909
(rr) when-ticks
Current tick: 143983372944
(rr) seek-ticks 143998750000

(rr) when-ticks
Current tick: 143998750000
(rr) when
Current event: 51911

(rr)
The trace tells us that it expected the segfault to happen at address rip:0x7f049e2ba8e3, so let's take a look there:
(rr) disas 0x7f049e2ba8e3
Dump of assembler code for function jl_apply_tuple_type:
[snip]
   0x00007f049e2ba8e0 <+96>:  mov    (%rax),%r10
   0x00007f049e2ba8e3 <+99>:  mov    -0x8(%r10),%r9
[snip]
Alright, so that's a load from r10. Luckily r10 is recorded in the trace: r10:0x1007f0490b784d0. A seasoned debugger will quickly recognize this pointer as too wide. In particular, in general, for user space pointers, the high byte is 0x00, but here it is 0x01 (gdb drops leading zeros). Sometimes unused pointer bits are used for extra information, but at least julia itself only uses the unused low bits for this purpose, not the high bits. That said, this trace included a significant number of external native libraries (including a full python environment), so it's certainly possible that some external library would have used such pointer tagging techniques. Let's do some more investigation. The first thing I tried to do was take a look at the pointer with the high bit manually cleared to see if it was a valid Julia object at all or just some junk that somehow ended up being loaded from:
(rr) p jl_(0x7f0490b784d0)
Array{Any, 1}
$1 = void
(rr)
Ok, so this is actually a pointer to a julia object (the type Array{Any, 1}) with a mysteriously set high bit. It's not necessarily unexpected for junk data to look like valid pointers. Junk data often comes from uninitialized re-use of memory, and could certainly pick up part of a valid pointer if such a pointer was previously at that memory location. To narrow things down further, let's gather some more information. We're still 10000 ticks away from the place where the segfault was supposed to occur, but let's see what's currently happening in the process:
(rr) bt
#0  type_hash (kj=<optimized out>, failed=failed@entry=0x7fff6ca7102c)
    at /buildworker/worker/package_linux64/build/src/jltypes.c:1003
#1  0x00007f049e2b5856 in typekey_hash (nofail=0, n=<optimized out>, key=0x435f2dc8,
    tn=0x7f0490b99000 <jl_system_image_data+150848>) at /buildworker/worker/package_linux64/build/src/jltypes.c:1013
#2  lookup_type (tn=0x7f0490b99000 <jl_system_image_data+150848>, key=0x435f2dc8, n=46200)
    at /buildworker/worker/package_linux64/build/src/jltypes.c:623
#3  0x00007f049e2b9655 in inst_datatype_inner (dt=<optimized out>, p=<optimized out>, p@entry=0x435f2dc0,
    iparams=iparams@entry=0x435f2dc8, ntp=<optimized out>, cacheable=cacheable@entry=1, stack=stack@entry=0x0,
    env=0x0) at /buildworker/worker/package_linux64/build/src/jltypes.c:1158
#4  0x00007f049e2bbefc in jl_inst_concrete_tupletype (p=p@entry=0x435f2dc0)
    at /buildworker/worker/package_linux64/build/src/jltypes.c:1399
#5  0x00007f049e2d856c in jl_f_tuple (F=<optimized out>, args=0x42f54590, nargs=46200)
    at /buildworker/worker/package_linux64/build/src/builtins.c:729

(rr) p jl_(((jl_value_t**)0x42f54590)[0])
Array{Any, (2,)}[
  Array{Float64, (1,)}[9.3902],
  0.00922841]
$2 = void
(rr) p jl_(((jl_value_t**)0x42f54590)[1])
Array{Any, (2,)}[
  Array{Float64, (1,)}[13.5571],
  0.01415]
$3 = void
(rr) p jl_(((jl_value_t**)0x42f54590)[20000])
Array{Any, (2,)}[
  Array{Float64, (1,)}[58.965],
  1.40691]
$4 = void
Alright, so we're currently trying to allocate a tuple of 42600 elements, all of which are 2-element arrays (of type Array{Any, 1}). Since 10000 is less than 42600, it's also quite likely that this is the operation that we crashed in during the recording (also remember that the crash location was jl_apply_tuple, which is part of the allocation of a new tuple type). However, we haven't quite explained things yet. If we set a breakpoint at the location of the crash:
(rr) b *0x7f049e2ba8e3
Breakpoint 1 at 0x7f049e2ba8e3: file /buildworker/worker/package_linux64/build/src/julia.h, line 1222.
(rr) c
Continuing.
[FATAL /home/keno/rr/src/ReplaySession.cc:636:check_pending_sig()]
we just get the divergence again, so it never actually reached this execution point, but diverged earlier (but only happened to crash there). Can we find out what happened? Looking back at the assembly, we see that r10 was loaded from rax, which we also have: rax:0x436487c0. What's there currently (remember we're still 10000 ticks before the crash)?:
(rr) p *(void**)0x436487c0
$5 = (void *) 0x7f0490b784d0
(rr) p jl_($5)
Array{Any, 1}
$6 = void
That's exactly the pointer we saw during the crash, but the high bit isn't set. The next thing we might want to ask is what (recorded) changes do happen to this memory location:
(rr) awatch *(void**)0x436487c0
Hardware access (read/write) watchpoint 1: *(void**)0x436487c0

(rr) c
Continuing.

Thread 1 hit Hardware access (read/write) watchpoint 1: *(void**)0x436487c0

Value = (void *) 0x7f0490b784d0 <jl_system_image_data+16912>
0x00007f049e2b584e in typekey_hash (nofail=0, n=<optimized out>, key=0x435f2dc8,
    tn=0x7f0490b99000 <jl_system_image_data+150848>) at /buildworker/worker/package_linux64/build/src/jltypes.c:1013
1013  /buildworker/worker/package_linux64/build/src/jltypes.c: No such file or directory.

typekey_eq (key=key@entry=0x435f2dc8, n=n@entry=46200, tt=<optimized out>, tt=<optimized out>)
    at /buildworker/worker/package_linux64/build/src/jltypes.c:560
560 in /buildworker/worker/package_linux64/build/src/jltypes.c
(rr)
Continuing.
[FATAL /home/keno/rr/src/ReplaySession.cc:636:check_pending_sig()]
 (task 19490 (rec:7760) at time 51911)
 -> Assertion `false' failed to hold. Replaying `SIGNAL: SIGSEGV(det)': expecting tracee signal or trap, but instead at `write' (ticks: 144040993972)
We see some accesses from the type cache, and then the divergence. What about in the other direction? (Note that the divergence crashed the rr process, so we have to first get back to the same execution point - luckily since this is a recording, everything is stable, so we can just seek-ticks right back to where we were).
(rr) awatch *(void**)0x436487c0
Hardware access (read/write) watchpoint 1: *(void**)0x436487c0
(rr) rc
Continuing.

Thread 1 hit Hardware access (read/write) watchpoint 1: *(void**)0x436487c0

Old value = (void *) 0x7f0490b784d0 <jl_system_image_data+16912>
New value = (void *) 0x0
jl_svecset (x=0x7f0490b784d0 <jl_system_image_data+16912>, i=<optimized out>, t=<optimized out>)
    at /buildworker/worker/package_linux64/build/src/julia.h:840
840 /buildworker/worker/package_linux64/build/src/julia.h: No such file or directory.
(rr) bt
#0  jl_svecset (x=0x7f0490b784d0 <jl_system_image_data+16912>, i=<optimized out>, t=<optimized out>)
    at /buildworker/worker/package_linux64/build/src/julia.h:840
#1  jl_f_tuple (F=<optimized out>, args=0x42f54590, nargs=46200)
    at /buildworker/worker/package_linux64/build/src/builtins.c:728
For reference, here's the relevant function we're currently in from the Julia 1.5 branch:
JL_CALLABLE(jl_f_tuple)
{
[snip]
    }
    else {
        jl_svec_t *types = jl_alloc_svec_uninit(nargs);
        JL_GC_PUSH1(&types);
        for (i = 0; i < nargs; i++)
            jl_svecset(types, i, jl_typeof(args[i]));
        tt = jl_inst_concrete_tupletype(types);
[snip]
}
The code is fairly straightforward: It's just iterating over the incoming arguments to tuple, and getting the types for each one (such that it can then create an appropriate tuple type that matches the argument). Clearly we just computed the type of one of the incoming arrays and are setting it into the svec. We can find out which array we just computed the type of:
(rr) disas
   0x00007f049e2d8530 <+240>: mov    -0x8(%r12,%r13,1),%rax
   0x00007f049e2d8535 <+245>: mov    -0x8(%rax),%rax
   0x00007f049e2d8539 <+249>: and    $0xfffffffffffffff0,%rax
   0x00007f049e2d853d <+253>: test   %rax,%rax
   0x00007f049e2d8540 <+256>: mov    %rax,(%r14,%r13,1)
=> 0x00007f049e2d8544 <+260>: je     0x7f049e2d8553 <jl_f_tuple+275>
(rr) rsi
(rr) rsi
(rr) rsi
(rr) rsi
=> 0x00007f049e2d8535 <+245>: mov    -0x8(%rax),%rax
   0x00007f049e2d8539 <+249>: and    $0xfffffffffffffff0,%rax
   0x00007f049e2d853d <+253>: test   %rax,%rax
   0x00007f049e2d8540 <+256>: mov    %rax,(%r14,%r13,1)
   0x00007f049e2d8544 <+260>: je     0x7f049e2d8553 <jl_f_tuple+275>
(rr) p /x $rax
$5 = 0x7f0478f5aa10
(rr) p jl_($rax)
Array{Any, (2,)}[
  Array{Float64, (1,)}[43.1183],
  0.86978]
$6 = void
We can also watch this array's type pointer to see if there's anything unexpected that messes with it:
(rr) p &((uint64_t**)0x7f0478f5aa10)[-1]
$9 = (void **) 0x7f0478f5aa08
(rr) p jl_((uint64_t)*$9 & ~0x3)
Array{Any, 1}
(note that we masked out the low bits, which julia does use as mentioned above - and if we looked at the assembly the code does the same).
To recap: We found a suspicious pointer 0x1007f0490b784d0, noticed it was loaded from 0x436487c0, which we then found was previously set by loading the type pointer from some array object. We then found that the address of said array object was 0x7f0478f5aa10, meaning that it's type pointer was at 0x7f0478f5aa08 (the value of which would eventually be propagated to the crash site). We further saw that at least in the replay, the value at 0x7f0478f5aa08 correctly pointed to the Array{Any, 1} type without any suspicious high bit flips.
Let's further look at all memory accesses to this type tag at 0x7f0478f5aa08 (going backwards in time) to see if we find anything suspicious:
(rr) awatch *0x7f0478f5aa08
Hardware access (read/write) watchpoint 6: *0x7f0478f5aa08

(rr) command 6
     when
     when-ticks
     c
     end

(rr) rc
Continuing.

(rr) bt
Thread 1 hit Hardware access (read/write) watchpoint 6: *0x7f0478f5aa08

Value = -1867021101
0x00007f049e2d8535 in jl_f_tuple (F=<optimized out>, args=0x42f54590, nargs=46200)
    at /buildworker/worker/package_linux64/build/src/builtins.c:728
728 /buildworker/worker/package_linux64/build/src/builtins.c: No such file or directory.
#0  0x00007f049e2d8535 in jl_f_tuple (F=<optimized out>, args=0x42f54590, nargs=46200)
    at /buildworker/worker/package_linux64/build/src/builtins.c:728
[snip]
Current event: 51911
Current tick: 143998538325

Thread 1 hit Hardware access (read/write) watchpoint 6: *0x7f0478f5aa08

Value = -1867021101
jl_isa (x=0x7f0478f5aa10, t=t@entry=0x7f0490b784d0 <jl_system_image_data+16912>)
    at /buildworker/worker/package_linux64/build/src/subtype.c:2064
2064  /buildworker/worker/package_linux64/build/src/subtype.c: No such file or directory.
#0  jl_isa (x=0x7f0478f5aa10, t=t@entry=0x7f0490b784d0 <jl_system_image_data+16912>)
    at /buildworker/worker/package_linux64/build/src/subtype.c:2064
#1  0x00007f049e2cd91c in sig_match_simple (lensig=<optimized out>, va=1, sig=<optimized out>, n=46201,
    args=0x42f54590, arg1=0x7f0492cdab30 <jl_system_image_data+35022960>)
    at /buildworker/worker/package_linux64/build/src/typemap.c:173
#2  jl_typemap_entry_assoc_exact (ml=<optimized out>, arg1=arg1@entry=0x7f0492cdab30 <jl_system_image_data+35022960>,
    args=args@entry=0x42f54590, n=n@entry=46201, world=world@entry=27833)
    at /buildworker/worker/package_linux64/build/src/typemap.c:675
#3  0x00007f049e2c914c in jl_typemap_assoc_exact (world=27833, offs=<optimized out>, n=46201, args=0x42f54590,
    arg1=0x7f0492cdab30 <jl_system_image_data+35022960>, ml_or_cache=<optimized out>)
    at /buildworker/worker/package_linux64/build/src/julia_internal.h:1075
#4  jl_lookup_generic_ (world=27833, callsite=<optimized out>, nargs=46201, args=0x42f54590,
    F=0x7f0492cdab30 <jl_system_image_data+35022960>) at /buildworker/worker/package_linux64/build/src/gf.c:2342
#5  jl_apply_generic (F=0x7f0492cdab30 <jl_system_image_data+35022960>, args=args@entry=0x42f54590, nargs=46200)
    at /buildworker/worker/package_linux64/build/src/gf.c:2394
#6  0x00007f049e2d8f04 in jl_apply (nargs=<optimized out>, args=0x42f54588)
    at /buildworker/worker/package_linux64/build/src/julia.h:1690
#7  do_apply (args=<optimized out>, nargs=<optimized out>, iterate=0x7f0493df96f0 <jl_system_image_data+52974640>,
    F=<optimized out>) at /buildworker/worker/package_linux64/build/src/builtins.c:655
[snip]
Current event: 51911
Current tick: 143998396840

Thread 1 hit Hardware access (read/write) watchpoint 6: *0x7f0478f5aa08

Value = -1867021101
jl_isa (x=0x7f0478f5aa10, t=t@entry=0x7f0490b784d0 <jl_system_image_data+16912>)
    at /buildworker/worker/package_linux64/build/src/subtype.c:2064
2064  in /buildworker/worker/package_linux64/build/src/subtype.c
#0  jl_isa (x=0x7f0478f5aa10, t=t@entry=0x7f0490b784d0 <jl_system_image_data+16912>)
    at /buildworker/worker/package_linux64/build/src/subtype.c:2064
#1  0x00007f049e2cd91c in sig_match_simple (lensig=<optimized out>, va=1, sig=<optimized out>, n=46201,
    args=0x52409d10, arg1=0x7f0492cdab30 <jl_system_image_data+35022960>)
    at /buildworker/worker/package_linux64/build/src/typemap.c:173
Current event: 51911
Current tick: 143984580058

Thread 1 hit Hardware access (read/write) watchpoint 6: *0x7f0478f5aa08

Value = -1867021101
0x00007f049e2d8535 in jl_f_tuple (F=<optimized out>, args=0x4179f790, nargs=46100)
    at /buildworker/worker/package_linux64/build/src/builtins.c:728
728 /buildworker/worker/package_linux64/build/src/builtins.c: No such file or directory.
#0  0x00007f049e2d8535 in jl_f_tuple (F=<optimized out>, args=0x4179f790, nargs=46100)
    at /buildworker/worker/package_linux64/build/src/builtins.c:728
[snip]
Current event: 51839
Current tick: 143756648123
This gives us a lot of information. Basically, we looked at the type tag a couple of times trying to allocate the tuple during event 51911, but other than that, nothing read or wrote it since event 51839. We also know that during event 51839 it must have still had the correct value, since otherwise we would have seen the crash there. At this point, we basically have the full story:
At some point after event 51839, something flipped the lowest bit of the high byte of either the type tag of array itself (at memory location 0x7f0478f5aa08) or the value of the type pointer in the svec of types (at memory location 0x436487c0). This causes the type cache lookup (the type_hash function we saw) to fail. As a result, the program tries to allocate a new type for this tuple, which then crashes because it attempts to actually look at the type corrupted type pointer. The observed segfault results. During replay, the bit does not get flipped, the type cache lookup succeeds and the program just goes along normally.
What kind of issues could cause a bit flip like this? We already checked for obvious explanations like a weird kernel or strange devices, which leaves more obscure causes: CPU microarchitecture issues (modern CPUs are basically JITs from their ISA to some other internal representation - this occasionally has bugs - just look for the phrase "complex microarchitectural conditions" in Intel errata), faulty memory, cosmic rays or similar issues. Single-bit flips in particular often point to hardware issues, since software tends to overwrite in 8-bit units at least (unless it does a read-update-write cycle, e.g. because of a bogus pointer, but just as a practical observation software induced divergences tend to mostly be stray writes of larger unit size). On the issue, I asked for two additional pieces of evidence: Another recording of the same program as well as a replay attempt on the original machine.
If the replay fails on the original machine as well (it did), this is some evidence against a microarchitectural issue (it's not guaranteed of course, but executing the exact same instruction sequence at least has some chance to re-trigger such an issue). As for the second recording, it failed in exactly the same way: A bit flip in the low bit of the high byte of some pointer. This strongly implicates faulty memory as the fault is in the same bit position across both runs, which could happen, if one particular bit of a memory cell is degraded (e.g. in such a way that charge leaks into it over time, or there is some damage to the particular data line that this bit is on). In particular, if the issue were radiation-induced (perhaps the user's office happens to be above the physics department fusion reactor), we would have not expected a preference for any particular bit index.
Having excluded these other issues to my satisfaction, I closed the report with my conclusion and encouraged the user to run memtest on their machine. And indeed, the next day I got the following screenshot:
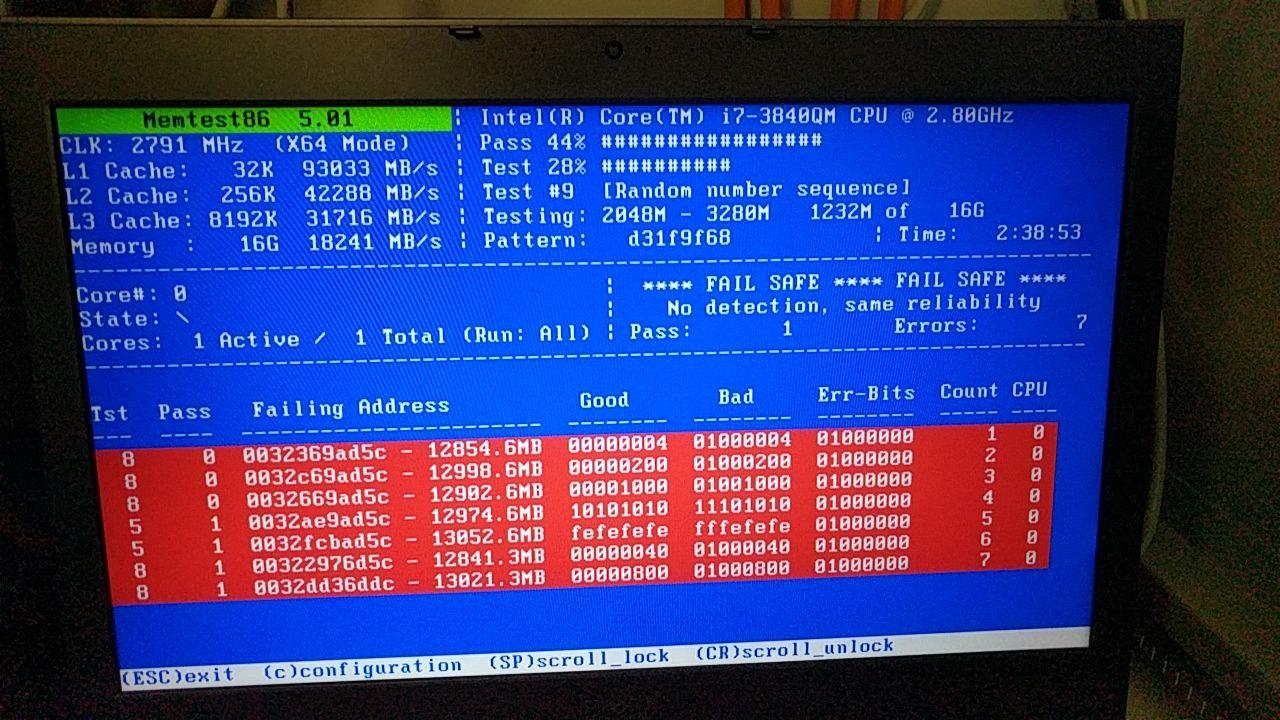
The failures reported are exactly what we expected: A 0->1 bit flip in the low bit of the high byte (second-highest nibble) of the memory location. Since all the failing memory addresses have then 0x5c address bits set, we can probably make the assumption that the bit that was flipped was that of the array itself (whose address ended in 0x8, i.e. having the high dword at 0xc), rather than the copy of the type tag in the svec (whose address ended in 0x0), but none of the detected failures exactly match the address offset of one of the two addresses we identified as potential targets for the bit flip (though the test in the screenshot was not run to completion, so maybe it would have found one). Further analysis of the failure would require physical access to the DRAM and perhaps an electron microscope, but we need not go there, because we've already determined this is not a Julia bug and the user will probably be replacing their machine.
With about an hour's work (plus 2-3 hours to add the seek-to-ticks functionality written, tested, upstreamed, etc.), we managed to remotely and conclusively diagnose that a reported crash was caused by faulty memory on the user's machine. Even though the rr trace did not contain the actual cause of the crash, it was nevertheless an invaluable tool to analyze this issue. The fact that the stray bit flip was missing from the recording already excluded 99% of possible cases for the crash, and some careful analysis of the trace gave enough clues to be able to eliminate most of the remaining. To quote Sherlock Holmes
When you have eliminated the impossible, whatever remains, however improbable, must be the truth.
Without rr, it may often be tempting to blame unexplained crashes on bad hardware, cosmic rays or gremlins living under the floor. Here, we were able to fairly convincingly conclude that that the issue must indeed be bad memory. I like to say that rr turns a debugging problem into a data analysis problem and here, as is so often the case, the most insightful piece is figuring out what data is missing.