Julia users like to think the programming language they love is easy to use and as such it can promote good programming practices, like writing documentation, testing the code and using continuous integration (CI). But... is that true? In order to try and answer this question and get more insights about the Julia ecosystem we developed a package called PackageAnalyzer.jl and over a 2-month period leading up to JuliaCon 2021 we used it to make a survey of the packages in the General registry. In this post we summarize the main findings we presented in our JuliaCon 2021 talk, which we recommend to watch for more details.
Lines of code in General
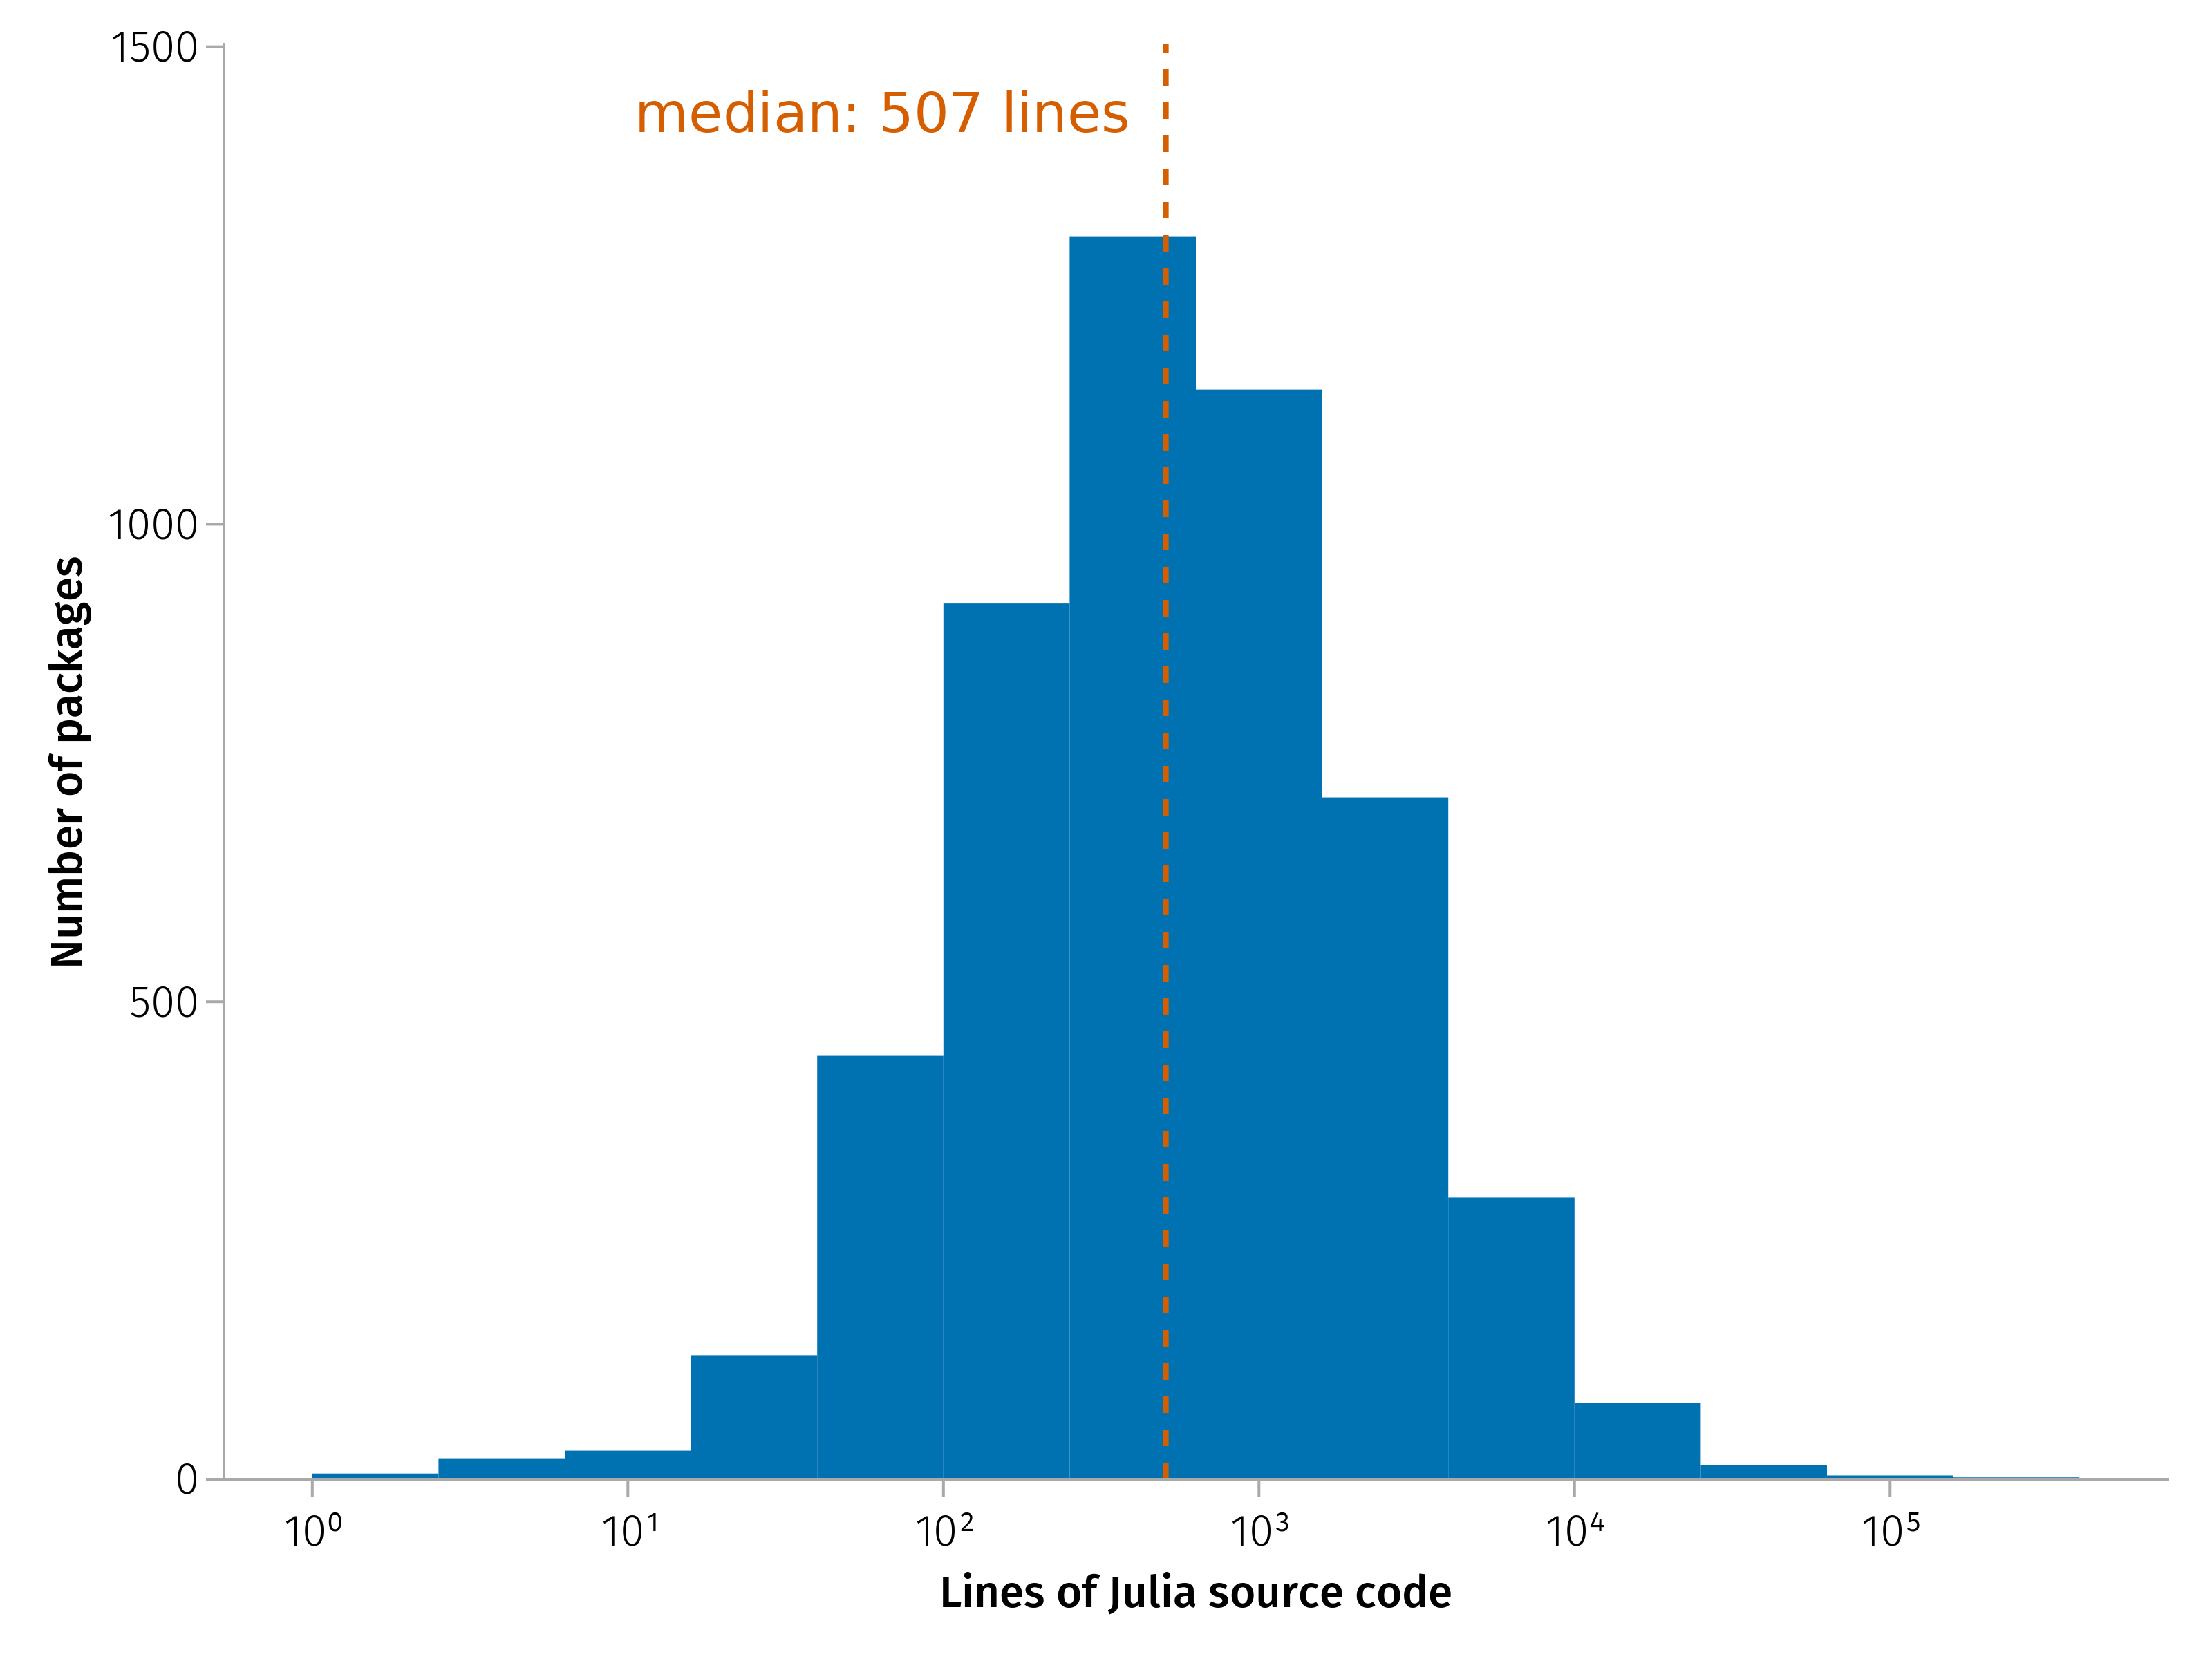
We found that as of 2021-01-07, the 5166 packages in the General registry have a total of 8,015,887 lines of Julia code in their src directories, and 11,777,430 lines of Julia code in package directories overall (including docs and tests). Note that these figures include docstrings, because of a bug in Tokei, the software we used to count the lines of code.
The following chart shows the distribution of packages by number of lines of code, in semi-log scale: we can observe that the packages follow a log-normal distribution, with a median of 507 lines.
We also used WordCloud.jl to create a word cloud of the packages in the General registry by number of lines and code.
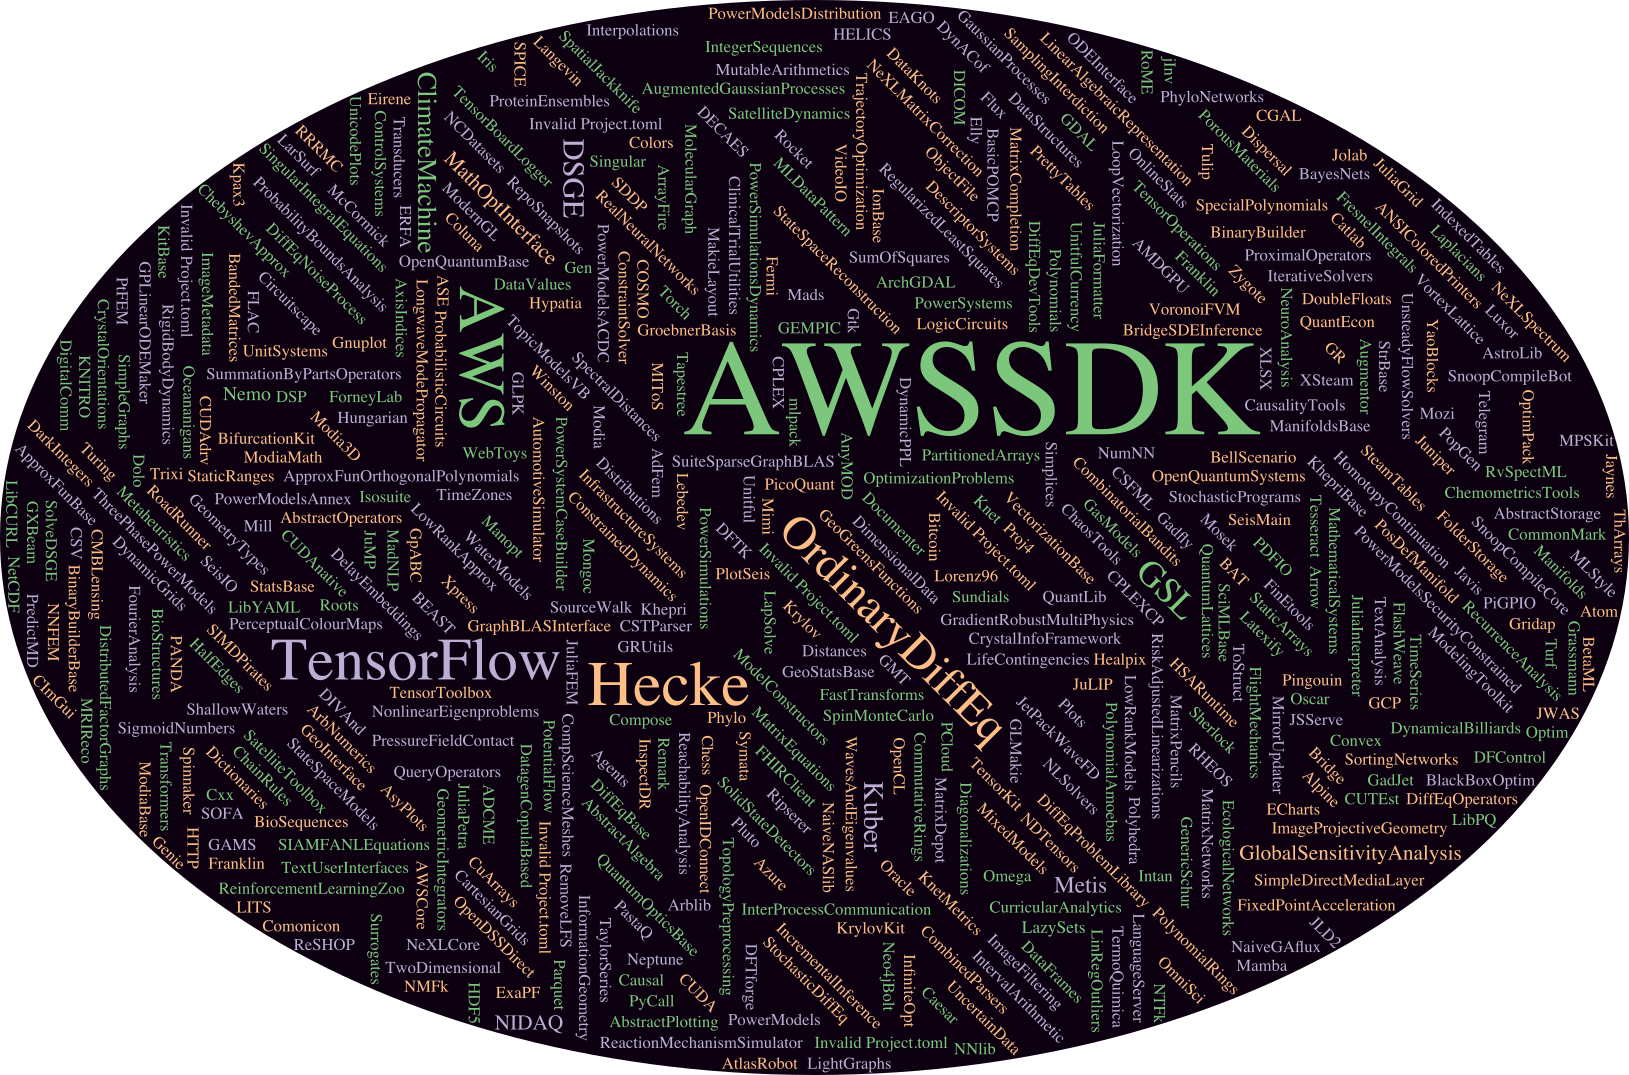
The following table shows the 14 largest packages in the registry, by number of lines of code in their src directories. We should note that many of these packages have their source code automatically generated from the API of the external libraries or web services they wrap.
| name | Lines of Julia code in src |
|---|---|
| AWSSDK | 264,115 |
| AWS | 225,723 |
| Hecke | 130,560 |
| TensorFlow | 115,544 |
| OrdinaryDiffEq | 92,308 |
| GSL | 69,761 |
| DSGE | 58,835 |
| ClimateMachine | 58,281 |
| Kuber | 54,331 |
| MathOptInterface | 51,297 |
| Azure | 44,766 |
| Nemo | 41,377 |
| NIDAQ | 40,913 |
| GlobalSensitivityAnalysis | 40,719 |
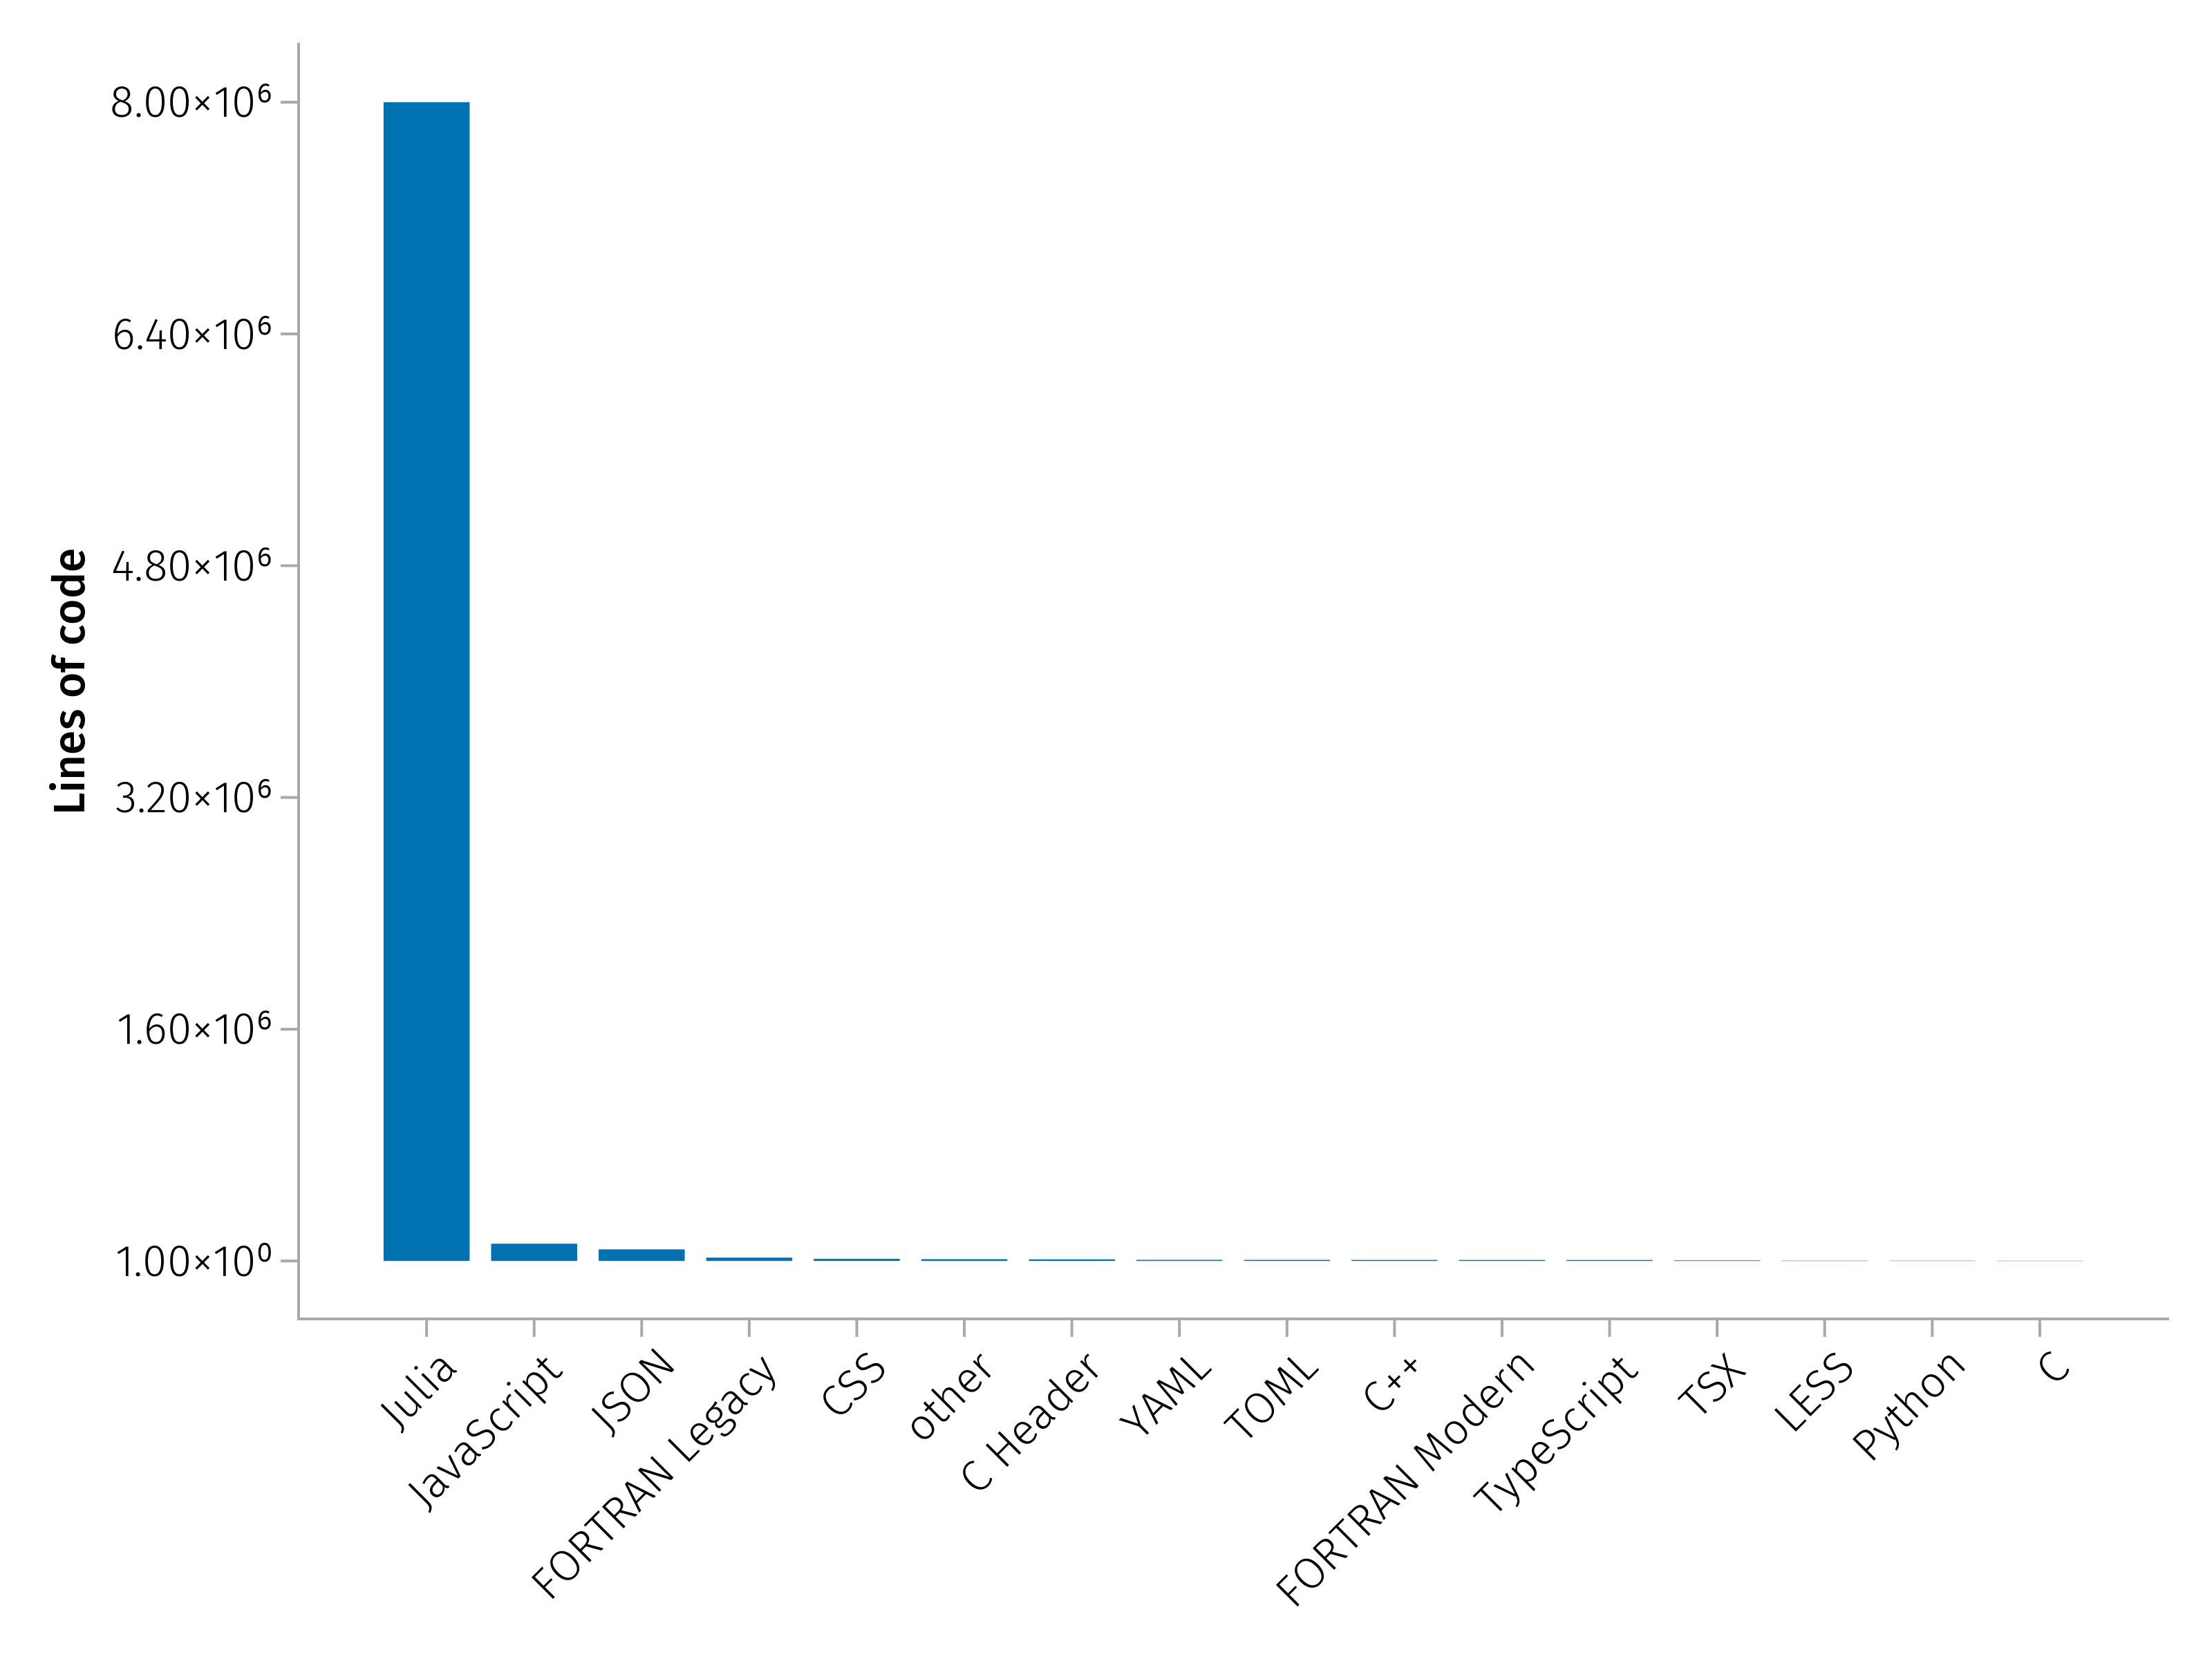
This chart shows the distributions of languages used in the files present in the src directories of packages: it was probably easy to guess that the most popular language is Julia itself, by a very large factor, followed by Javascript, JSON and Fortran. However note that these figures don't capture packages wrapping binary libraries using the so-called JLL packages, as they would automatically download pre-built copies of such libraries, without the need to vendor their source code.
Licenses
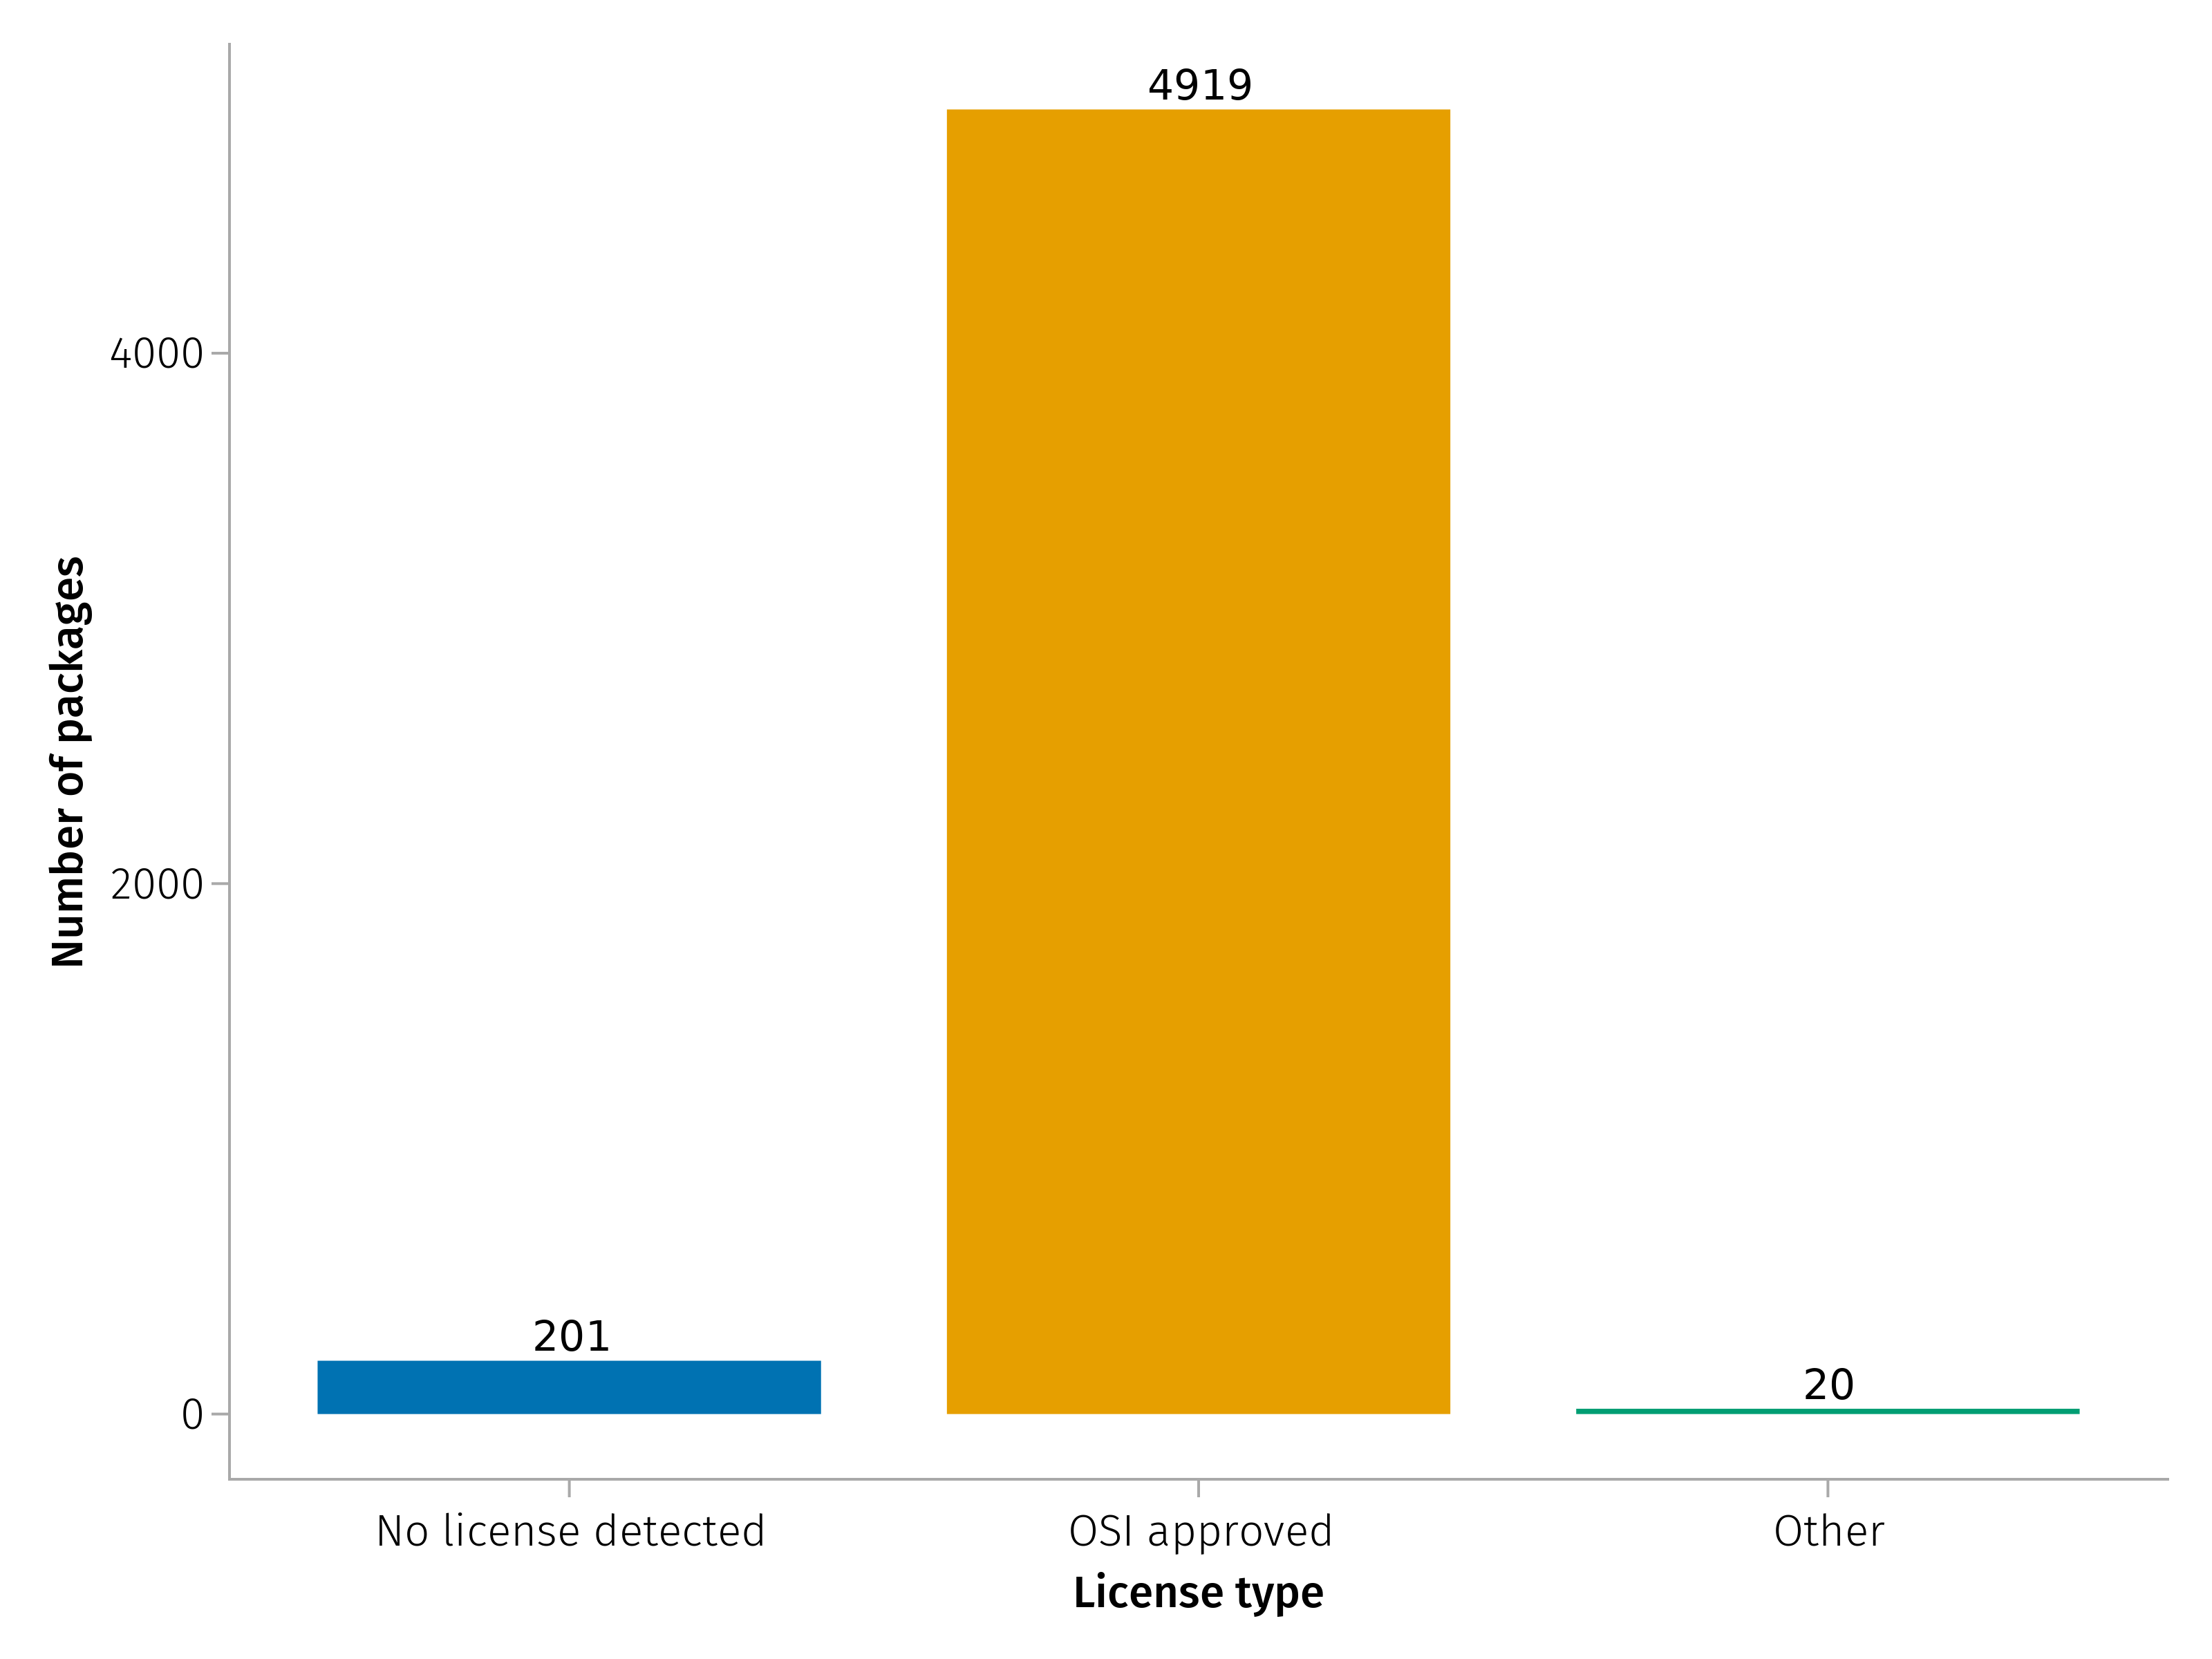
While over 96% of packages in the General registry have licenses approved by the Open Source Initiative (OSI), about 200 packages appear to not have any license at all, while 20 have a license which isn't automatically detected as OSI-approved.
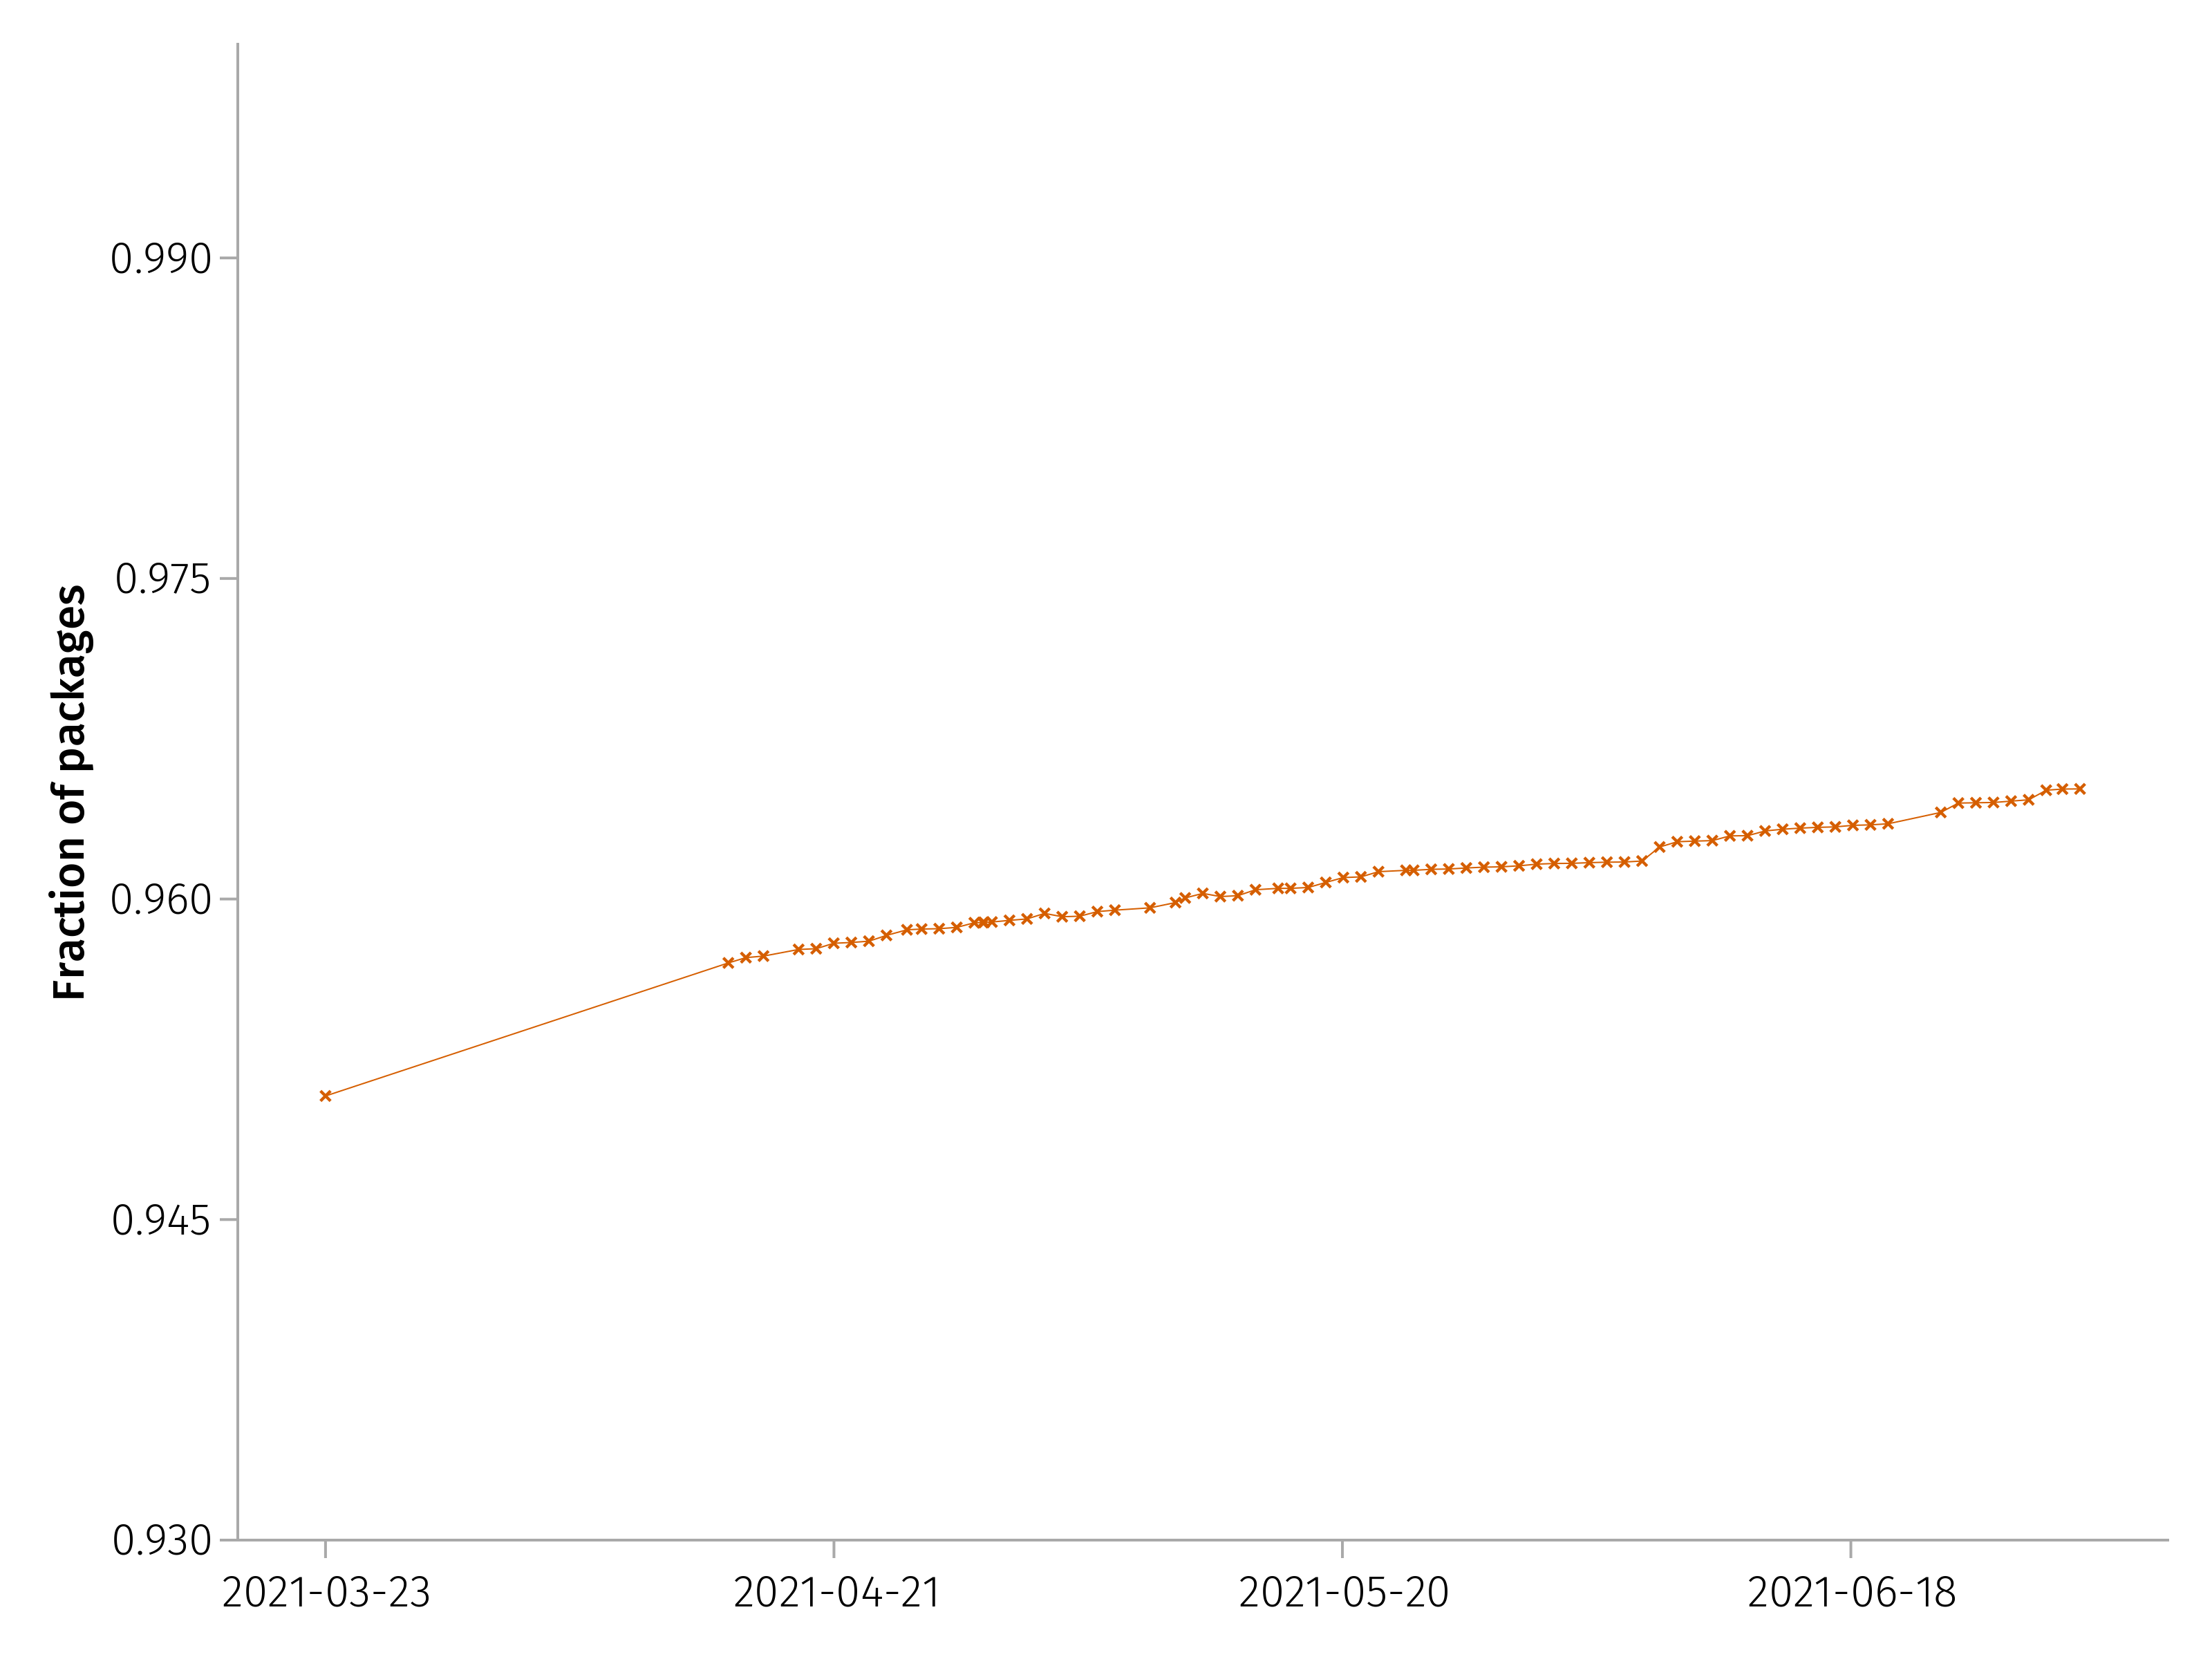
Julia's public package registries have long required OSI-approved licenses (stretching back to October 2015), but this requirement was not documented in the General registry README for some time, and has only been automatically enforced since last March. Now, any new package or new version of an already-registered package must have an auto-detected OSI-approved license to get automatic approval for merging into General. Since the introduction of this automated check, the fraction of packages with OSI-approved license has been steadily increasing.
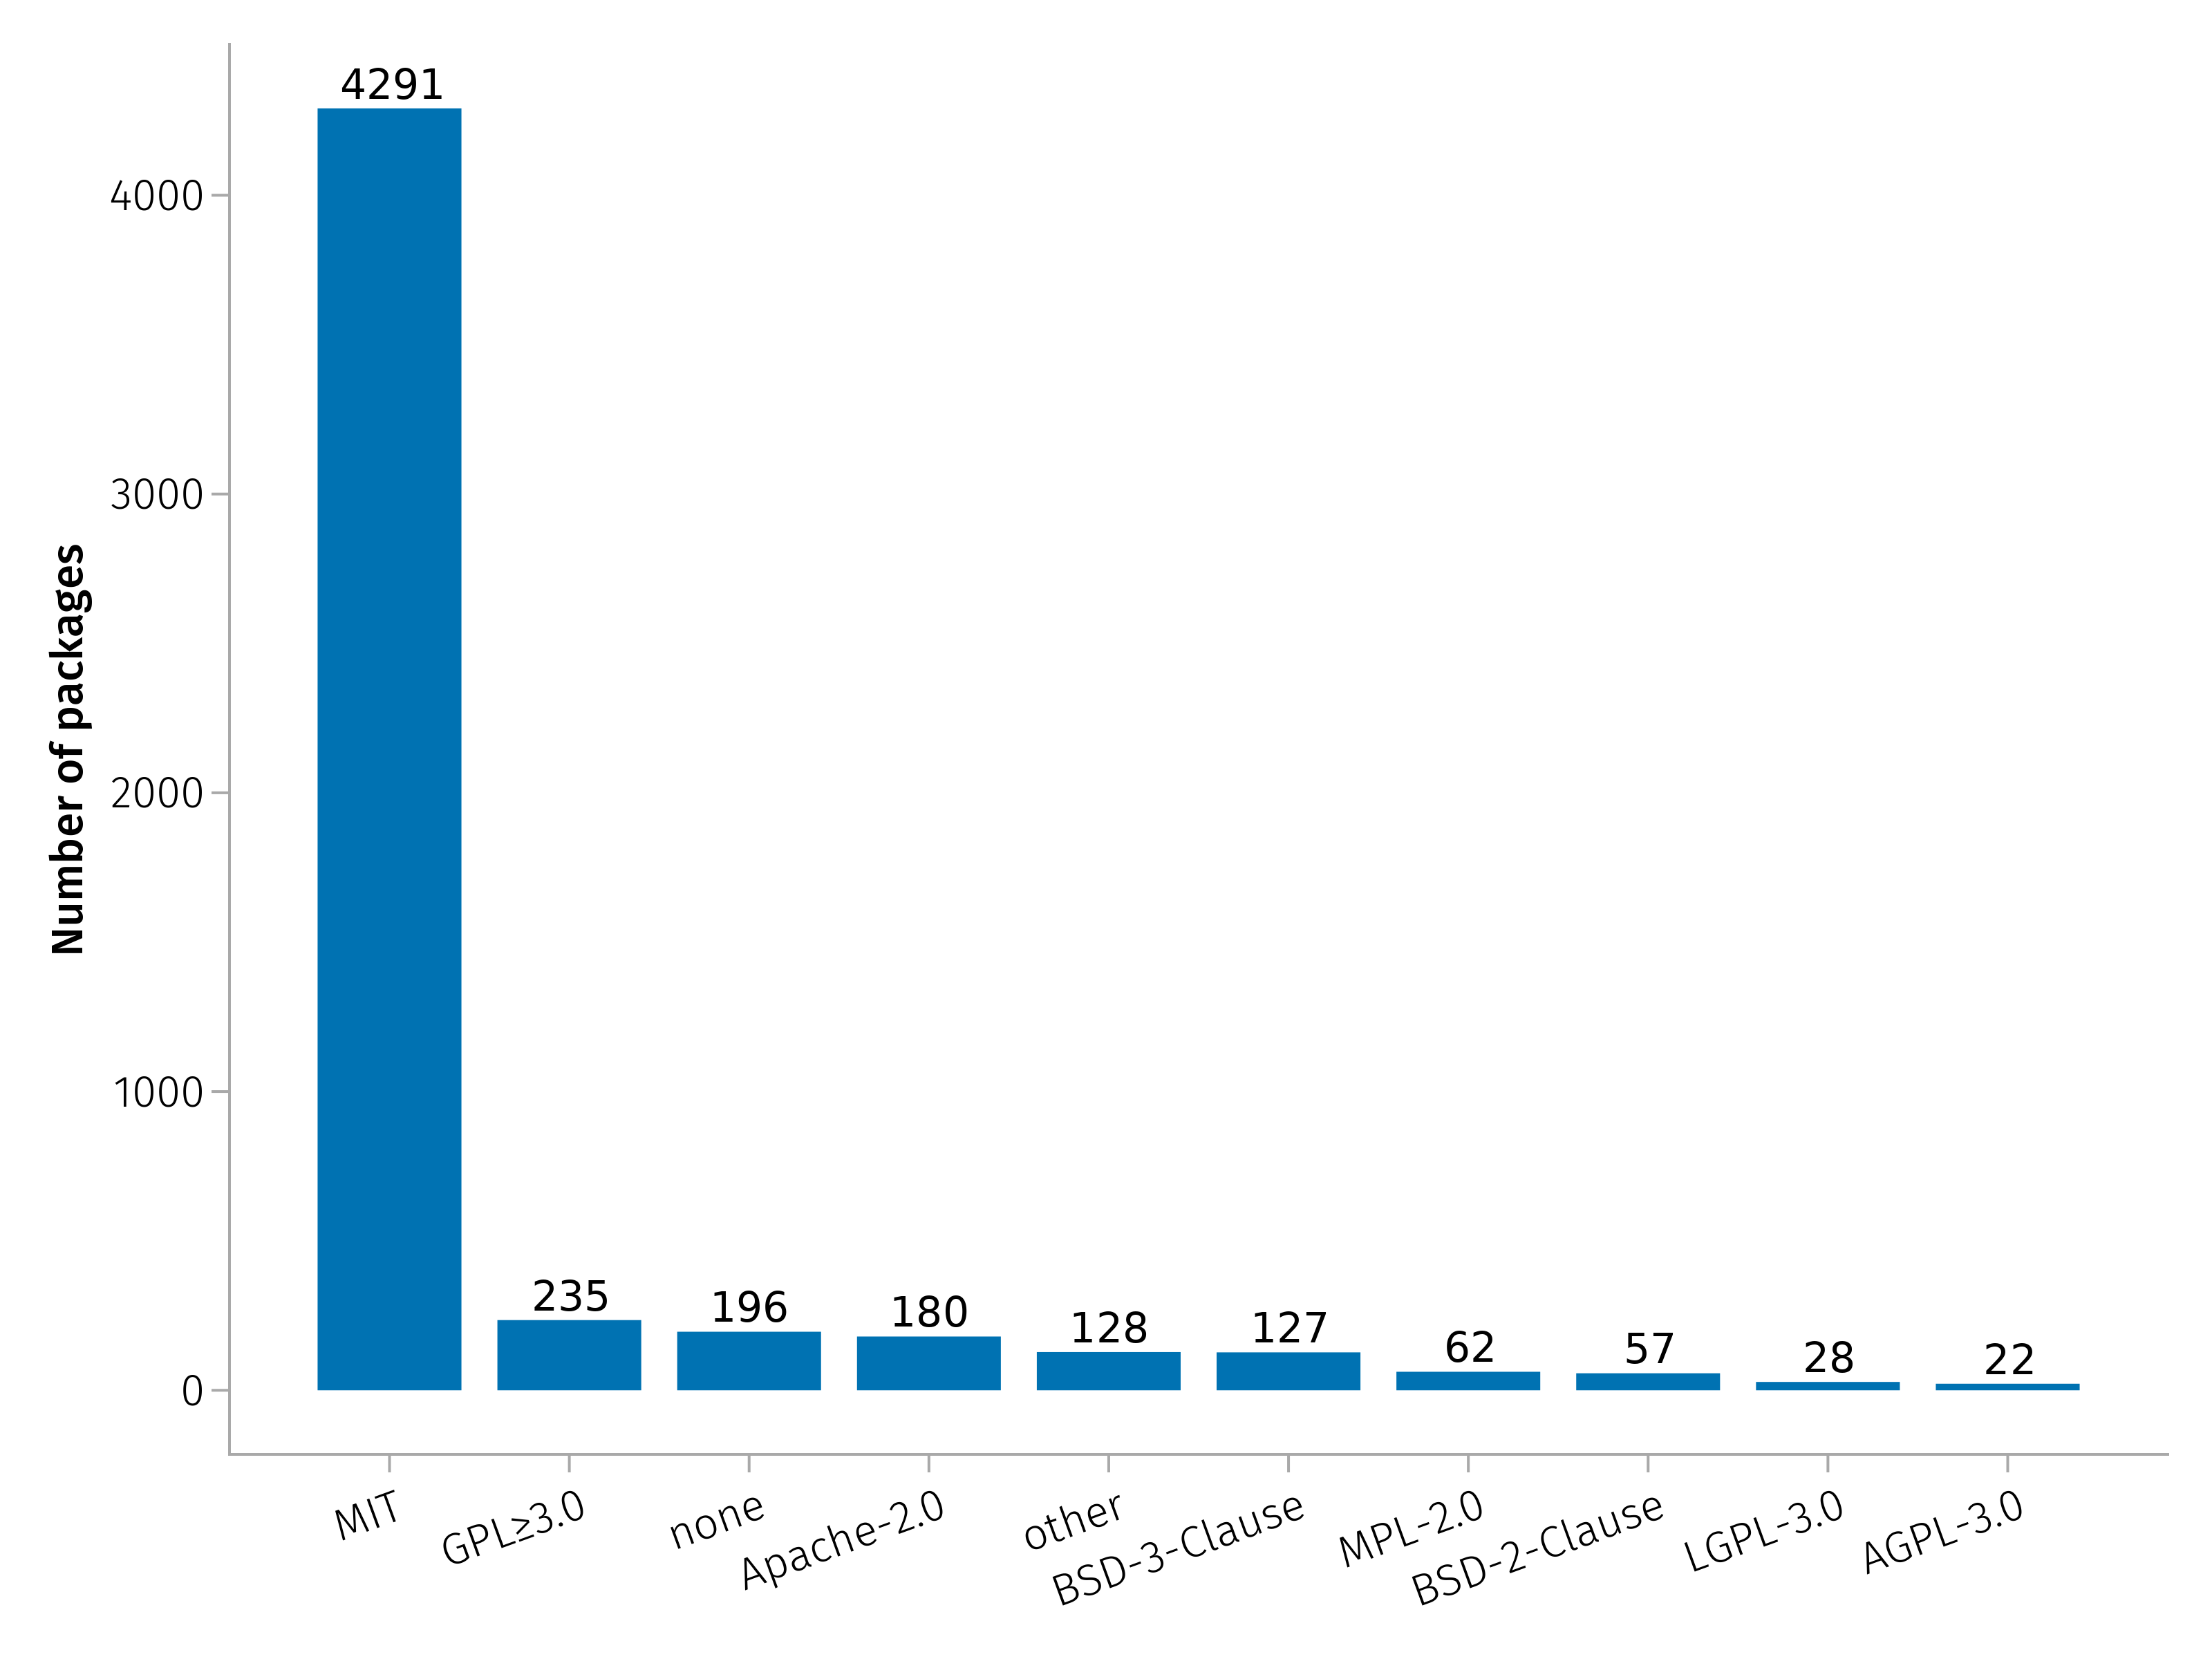
The MIT "Expat" license is by far the most popular in the Julia ecosystem, likely due to the fact it's the license adopted by the source code of Julia itself. Other popular licenses include GPL (v3 or v3 and any later versions), Apache 2.0 and the 3-clause BSD.
Documentation
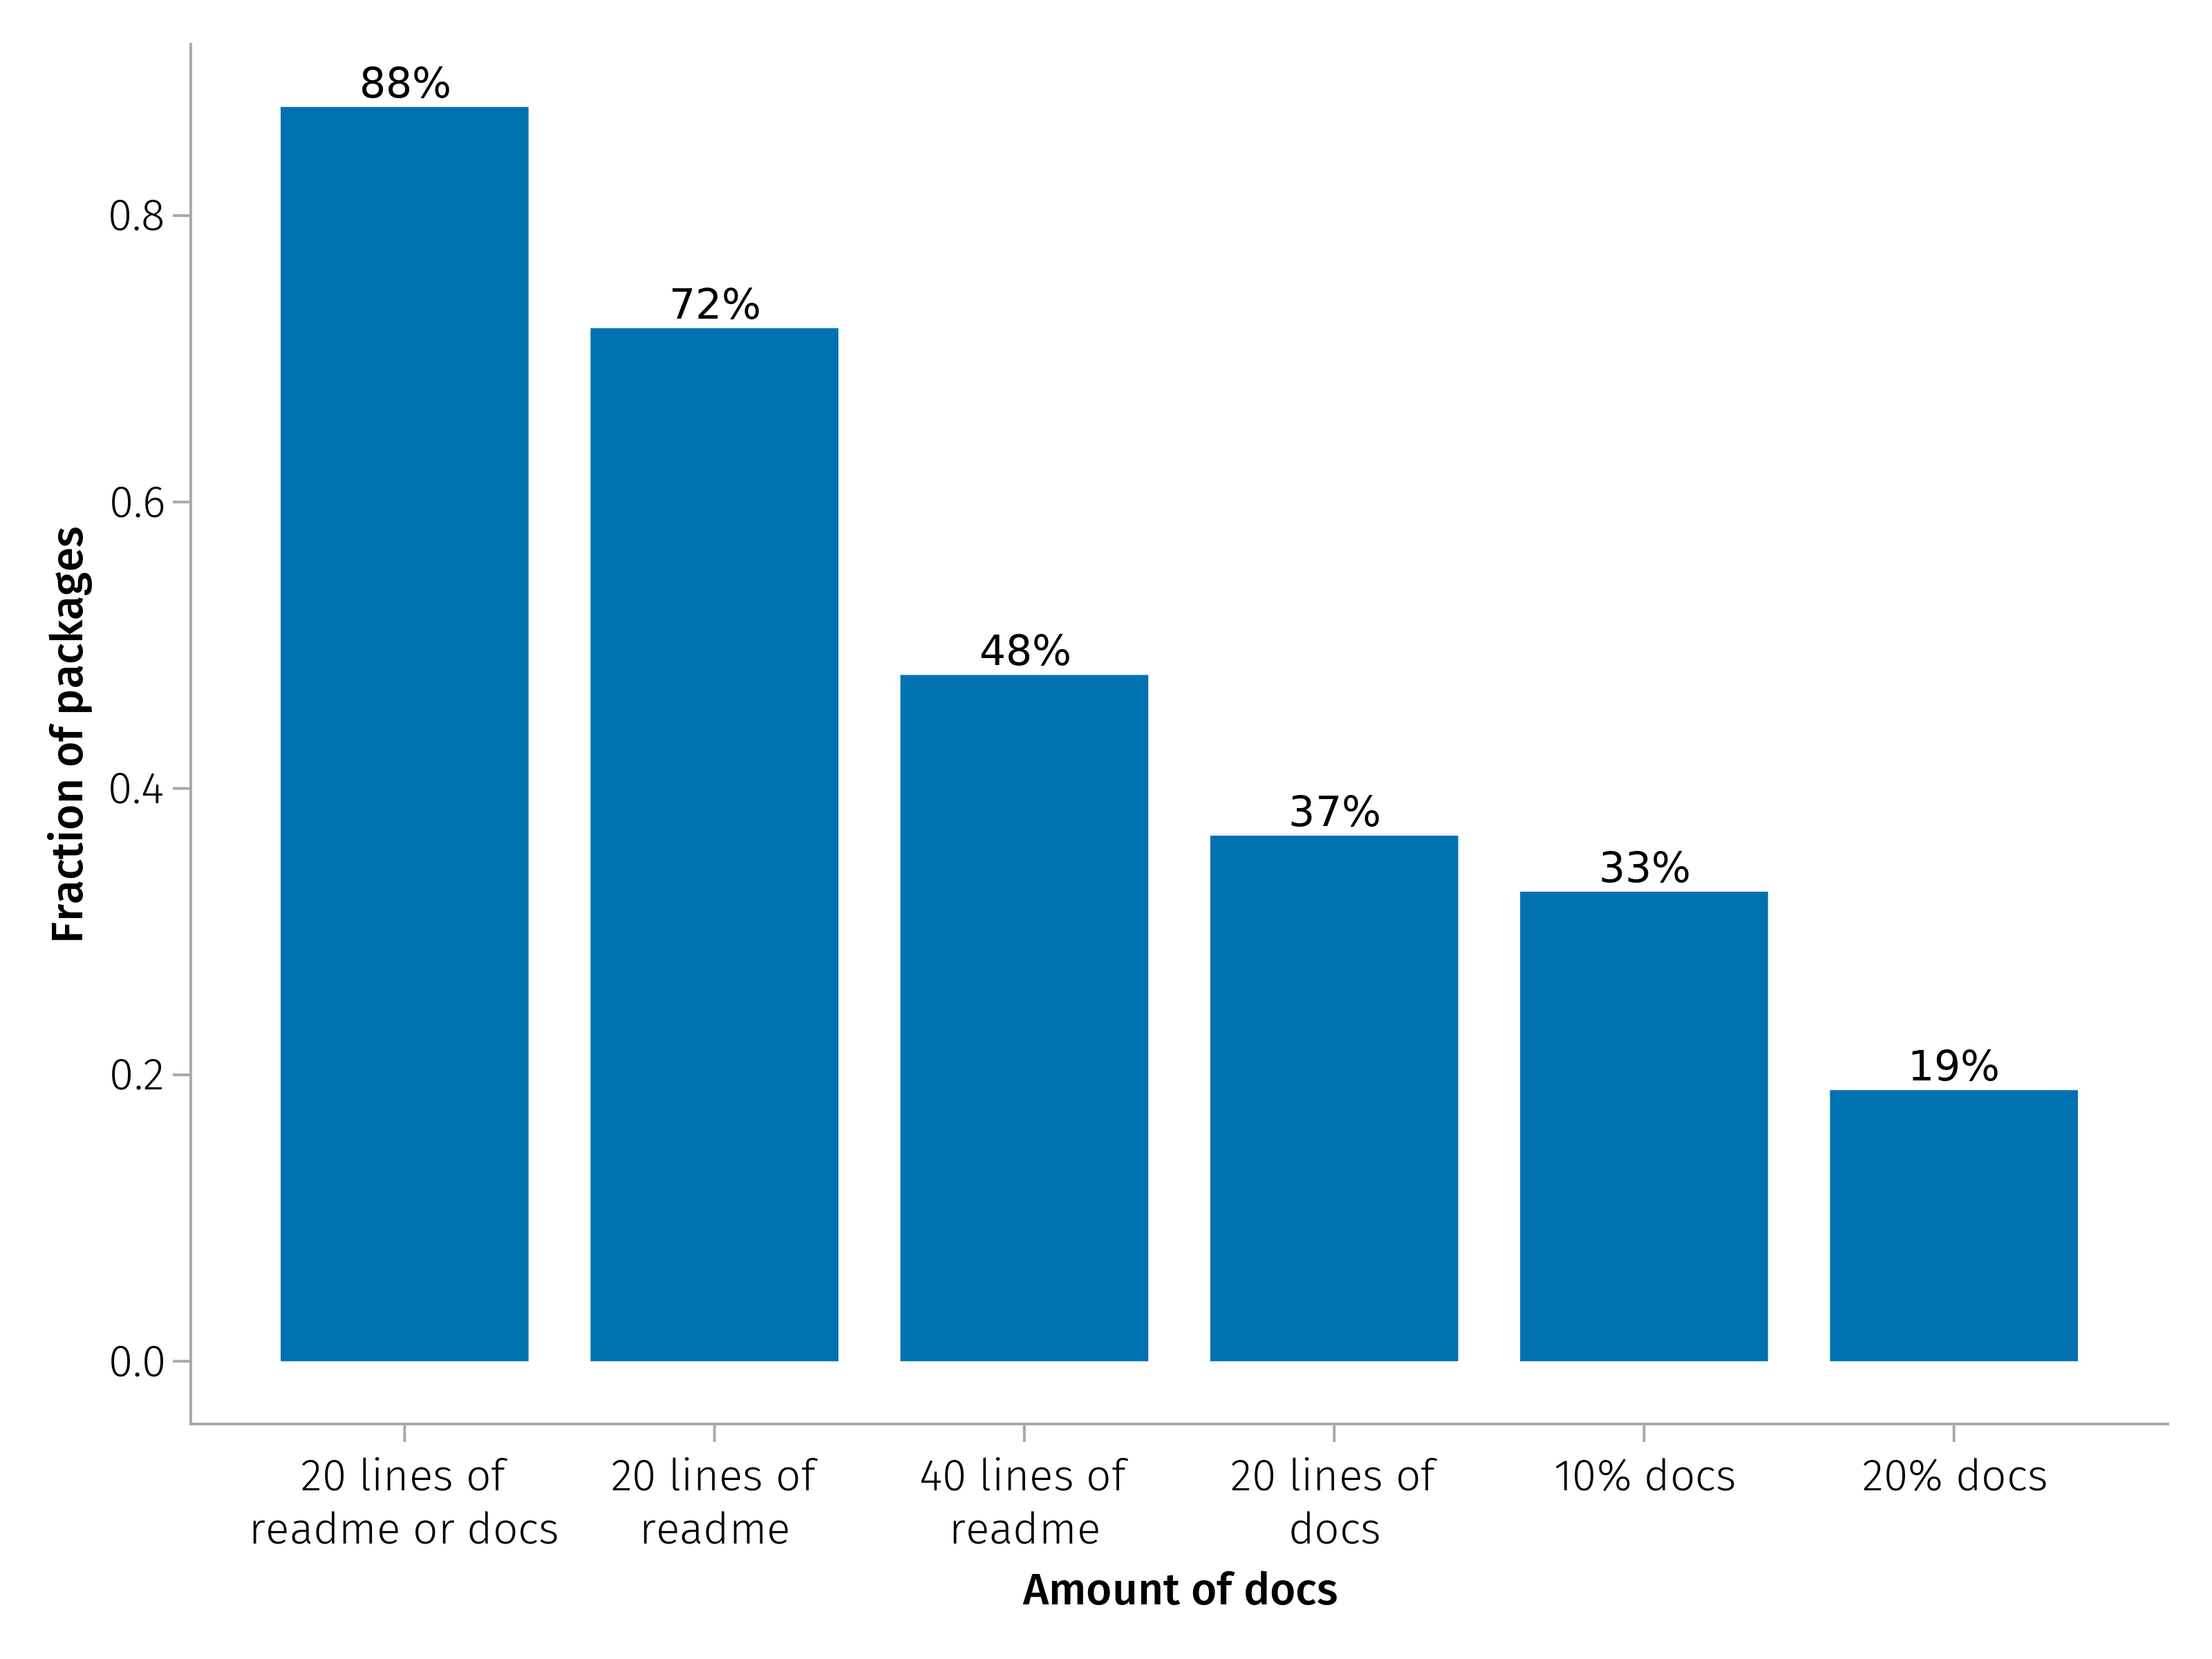
If you want to let other people use your package, you likely want to document it! This usually comes in the form of some paragraphs in the README file, or a dedicated manual written with the tools available to Julia users (e.g. Documenter.jl). About 88% of the packages in General have either 20 lines in the README file or proper documentation.
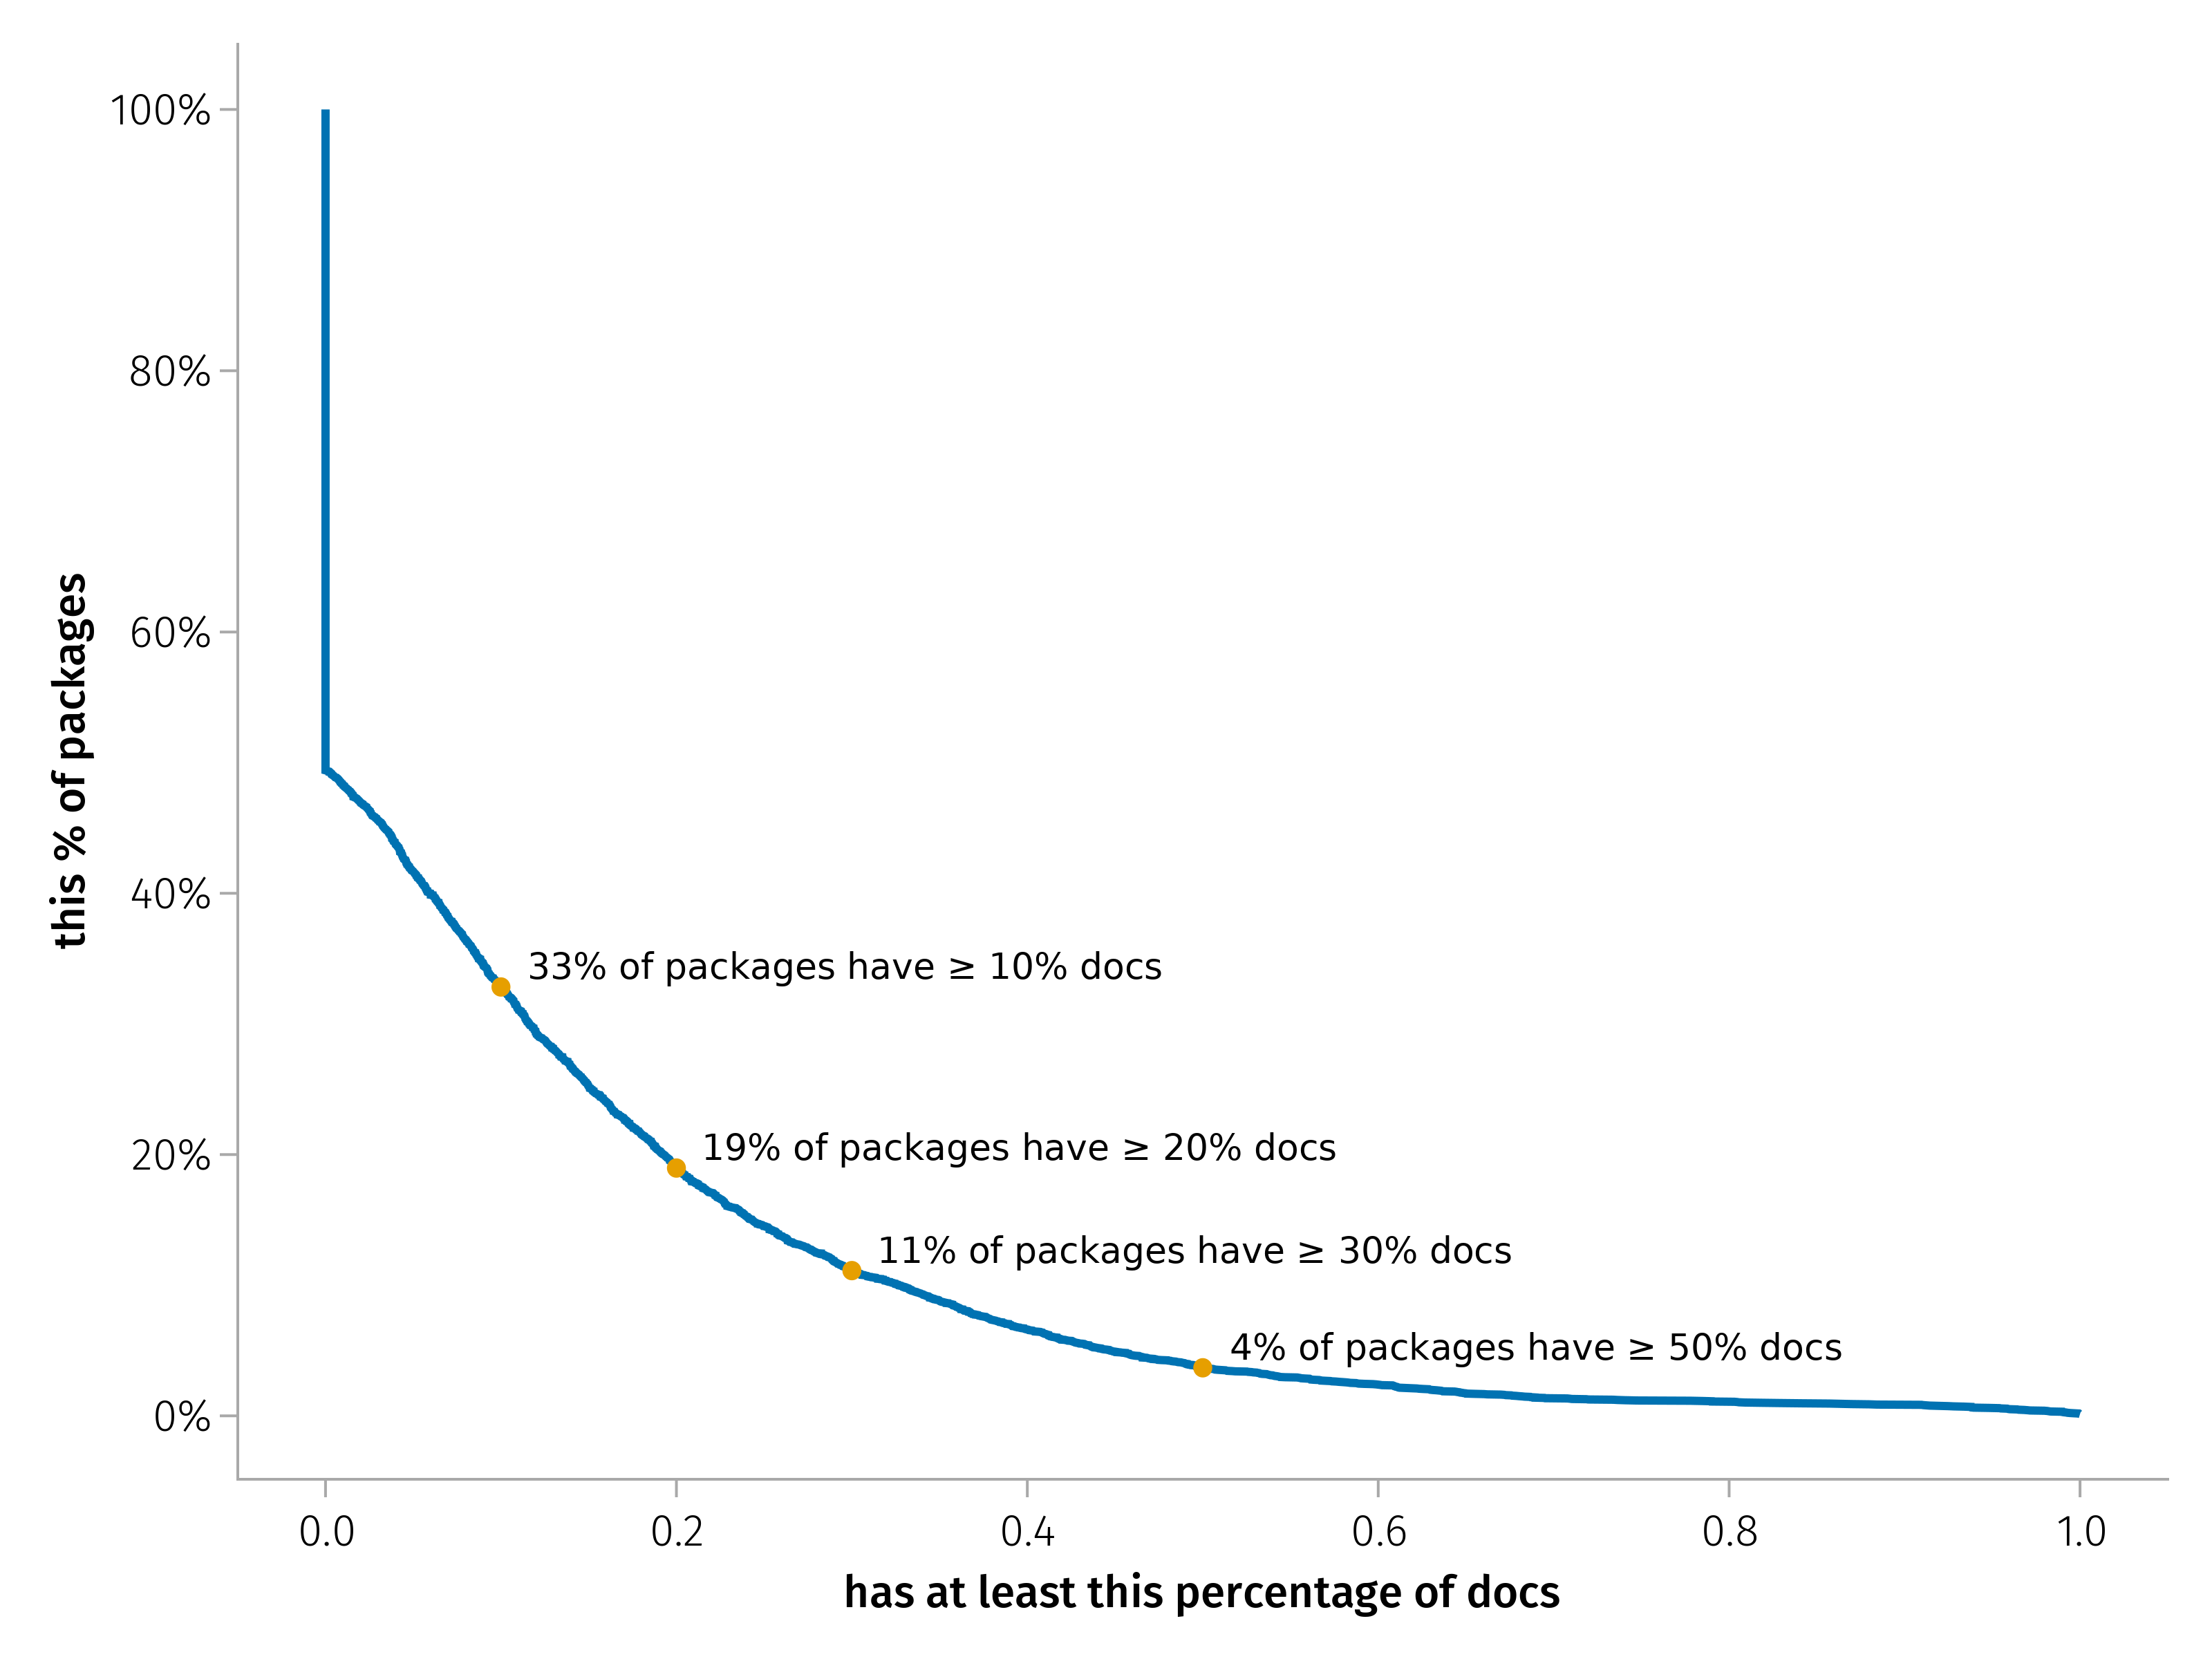
The following chart shows the distribution of the percentage of docs in the codebase of the repository, by computing the fraction of lines of code in the docs directory over the total number of lines of code in the docs and src directories. Less than 50% of the packages have Documenter.jl-based documentation in their repository. Does this mean over half of Julia packages are not documented? Not necessarily: authors of very simple packages may consider the README enough to describe the use of their package. This may also correlate with the fact that the majority of packages are relatively short (no more than ~500 lines of code including docstrings). Additionally, in some cases the source code of the documentation may be hosted in a different repository, which wouldn't be counted here.
Testing
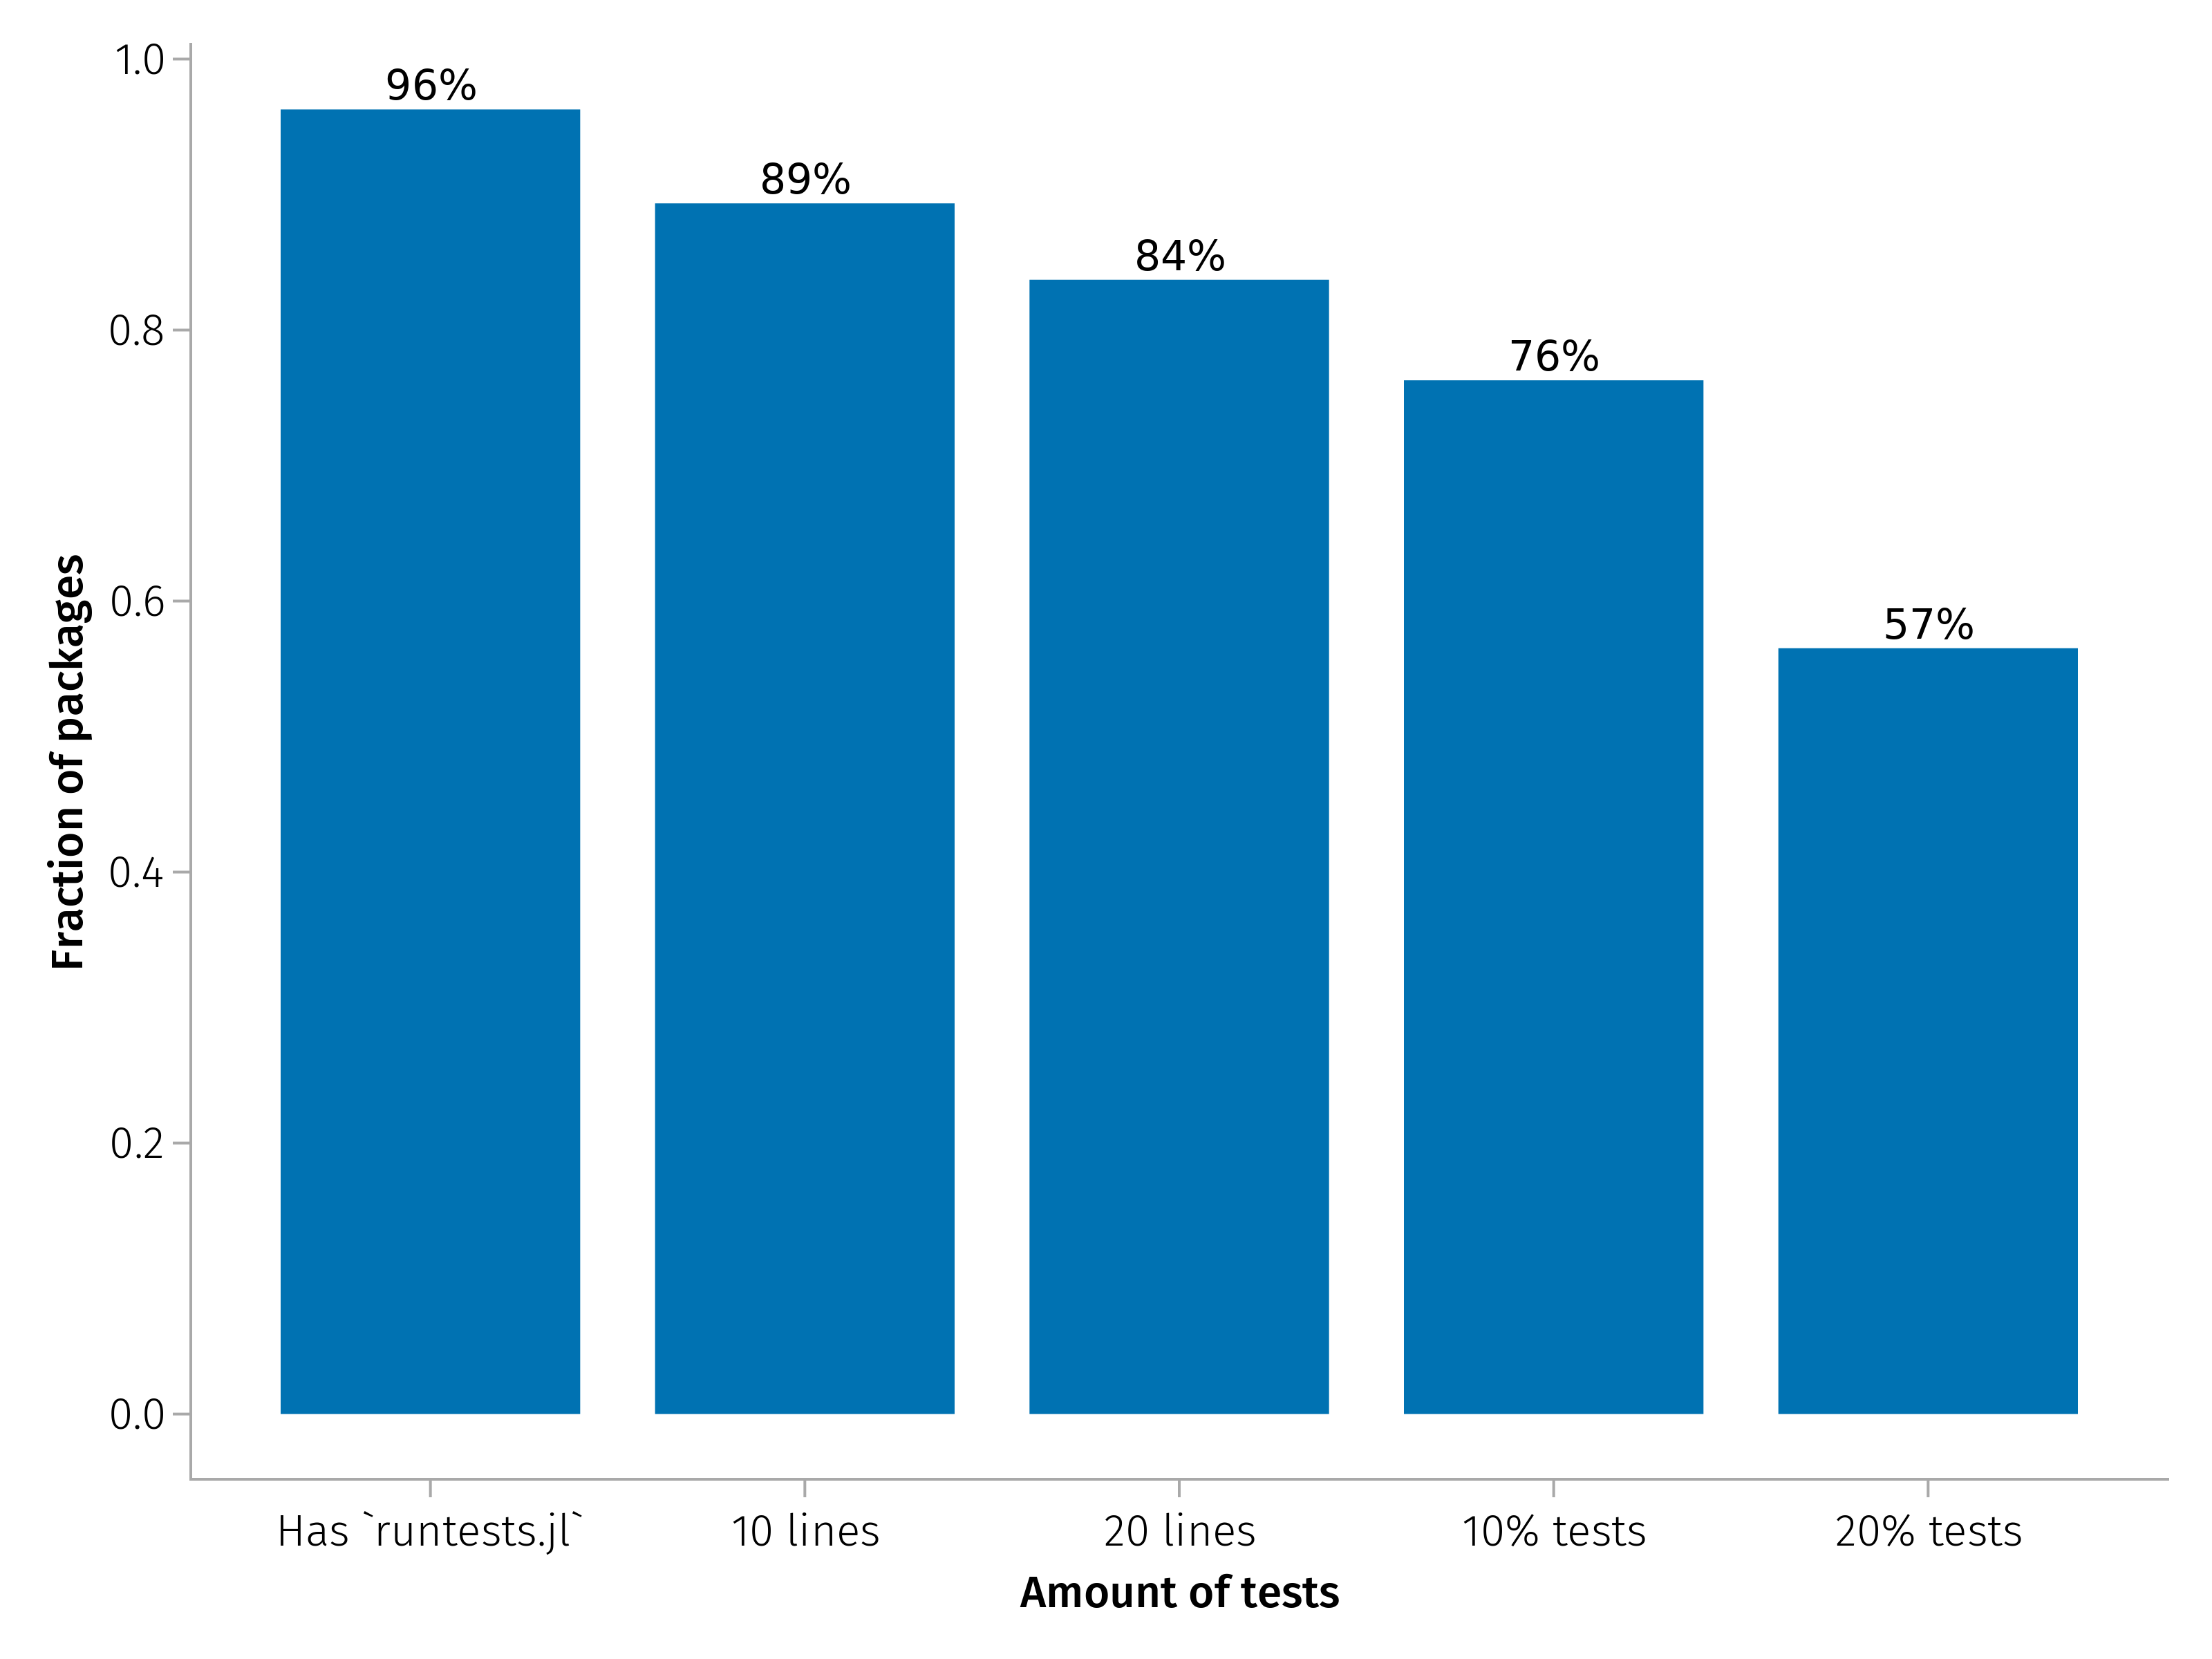
Testing is another important programming practice: it lets make sure the code behave as expected and that bugs that have been fixed once aren't reintroduced by later changes. Julia comes with the Test standard library. Likely the fact that Julia comes with a built-in unit testing framework encourages users to test their packages: over 96% of packages in the General registry have the test/runtests.jl file, which is the entry point for running the tests with Julia's the package manager. If we consider only packages with at least 10 lines of code in the test directory, to make sure we exclude simple auto-generated files with no actual tests, the fraction goes down to 89%. In the following chart, the percentages ("10% tests", and "20% tests") mean the number of lines of Julia code in test compared to the number of lines of Julia code in src plus test.
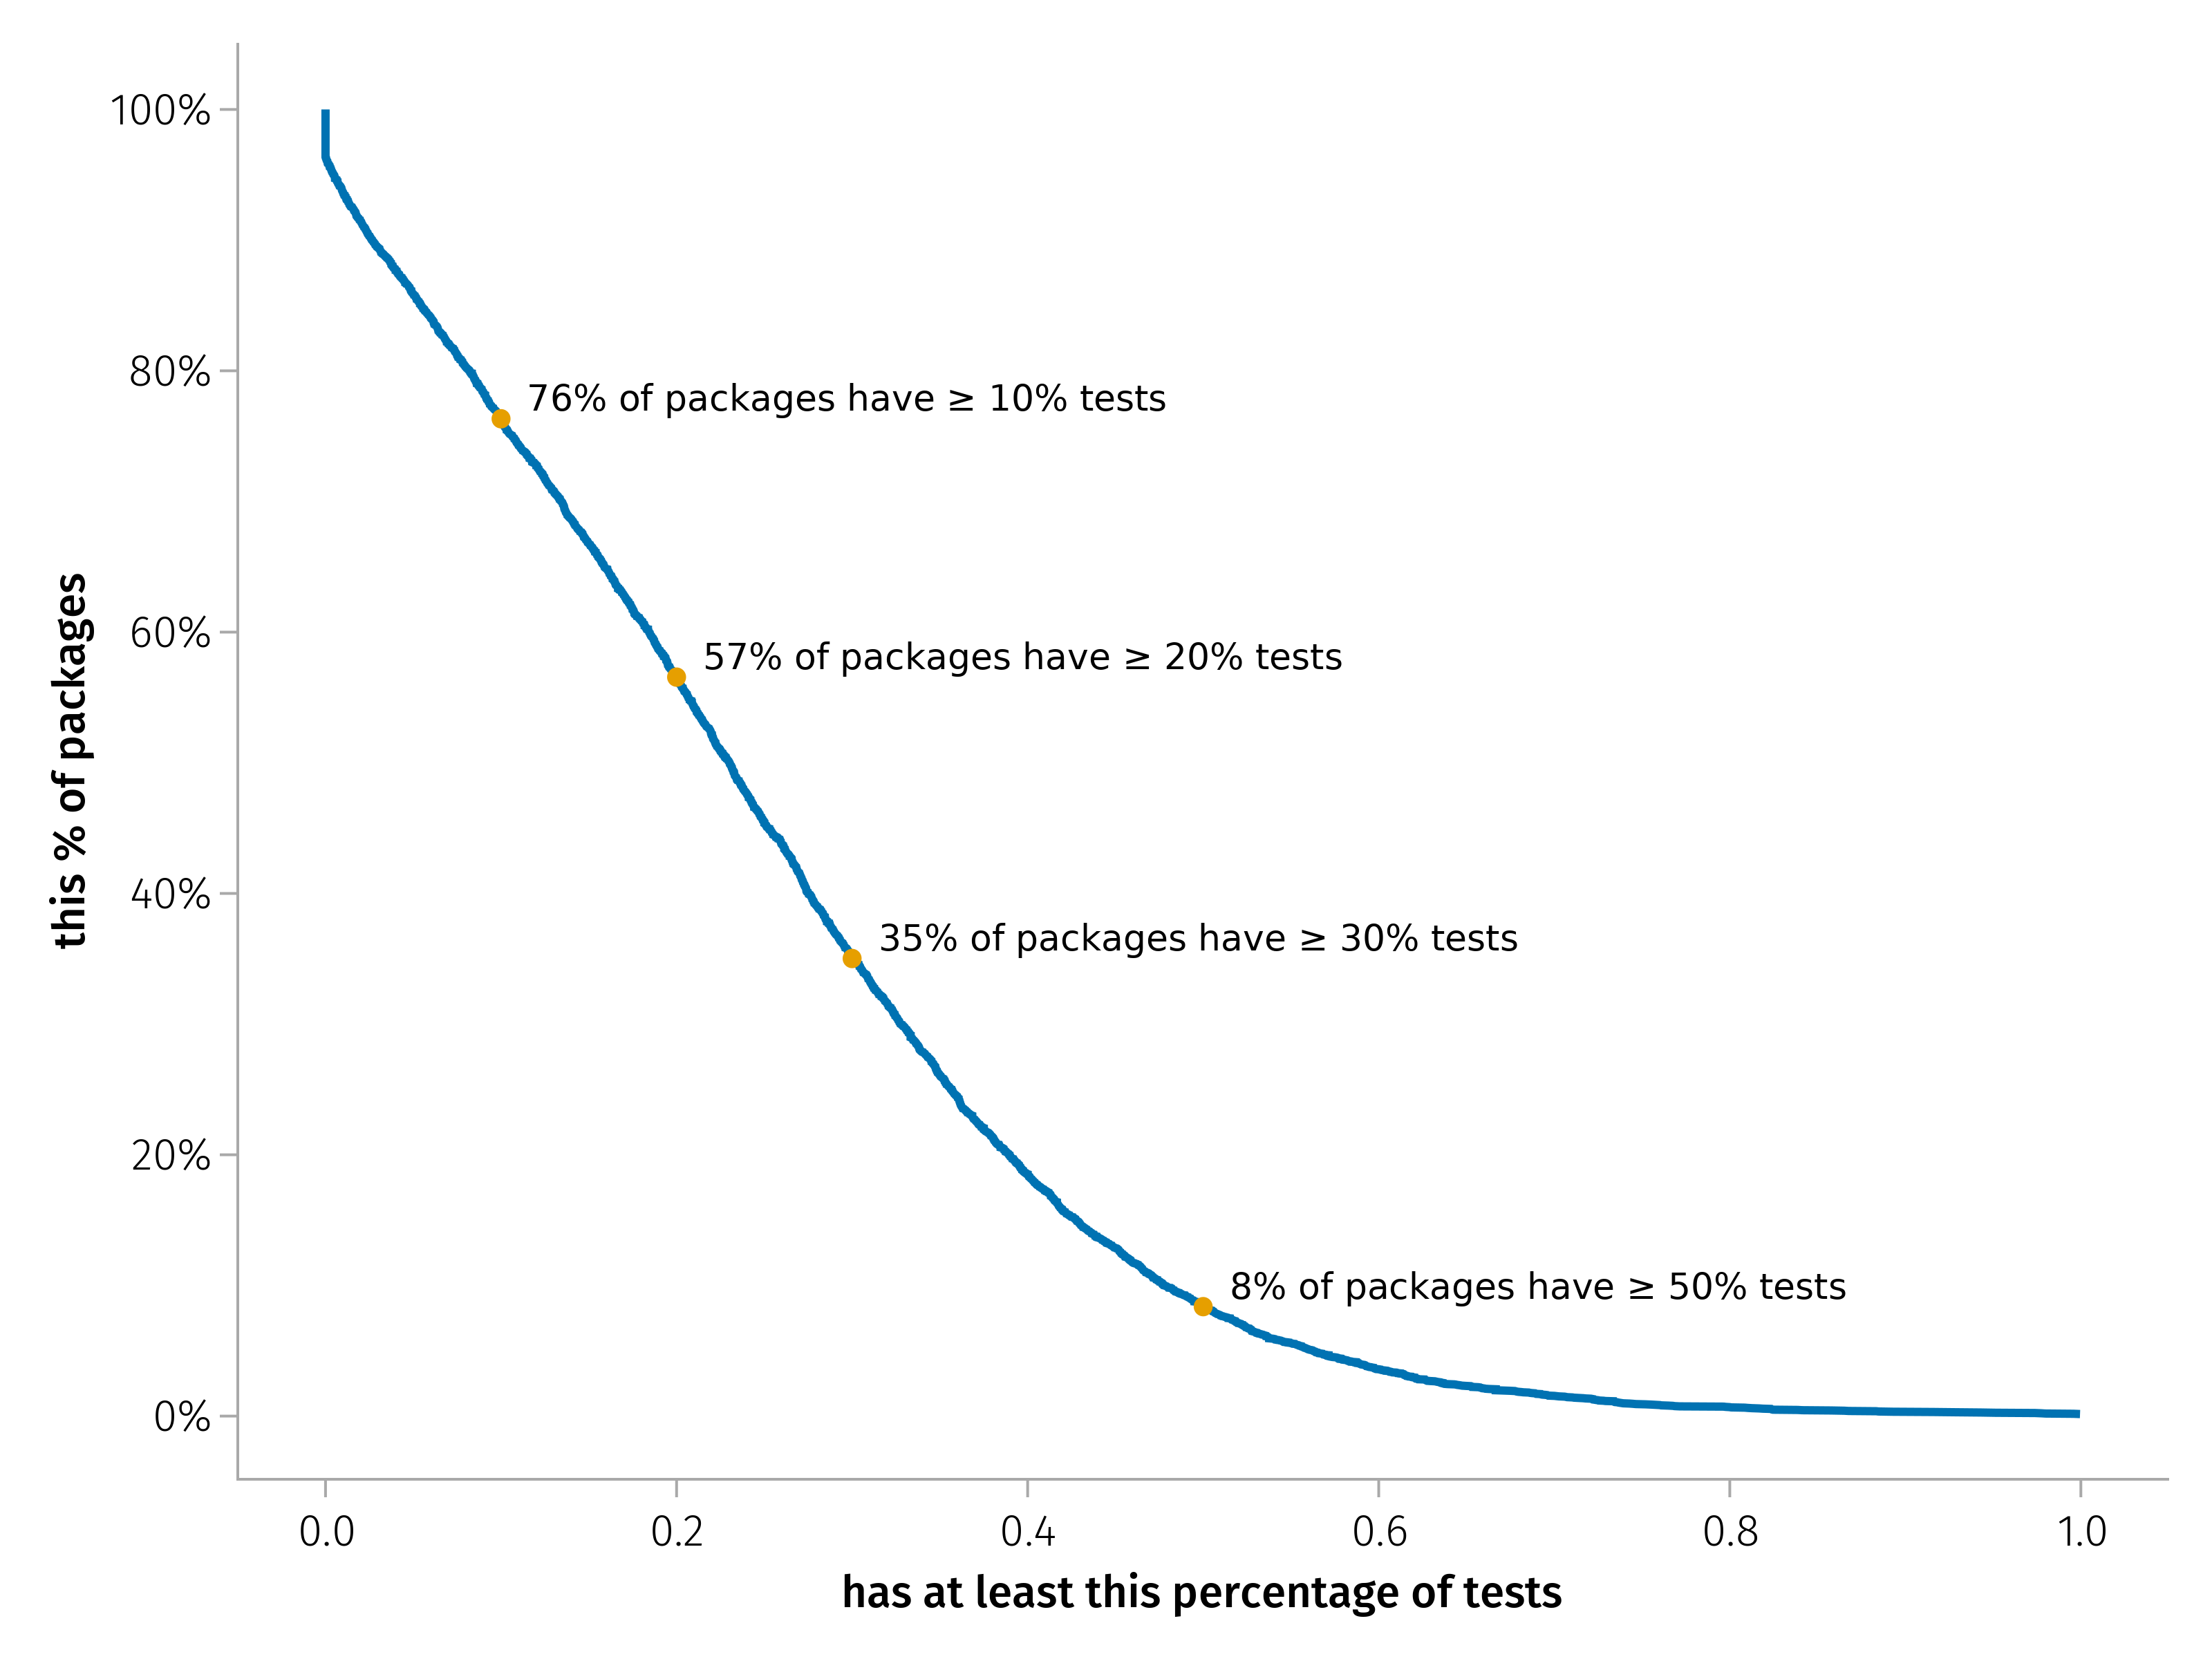
Similarly to what we have seen above for docs, the following chart shows the distribution of the percentage of tests in the codebase of the repository, as fraction of lines of code in the tests directory over the total number of lines of code in the tests and src directories. We can observe that the level of testing is fairly high: 57% of packages have at least 20% of code as tests, while 8% of packages have more lines of tests than of source code.
Continuous integration
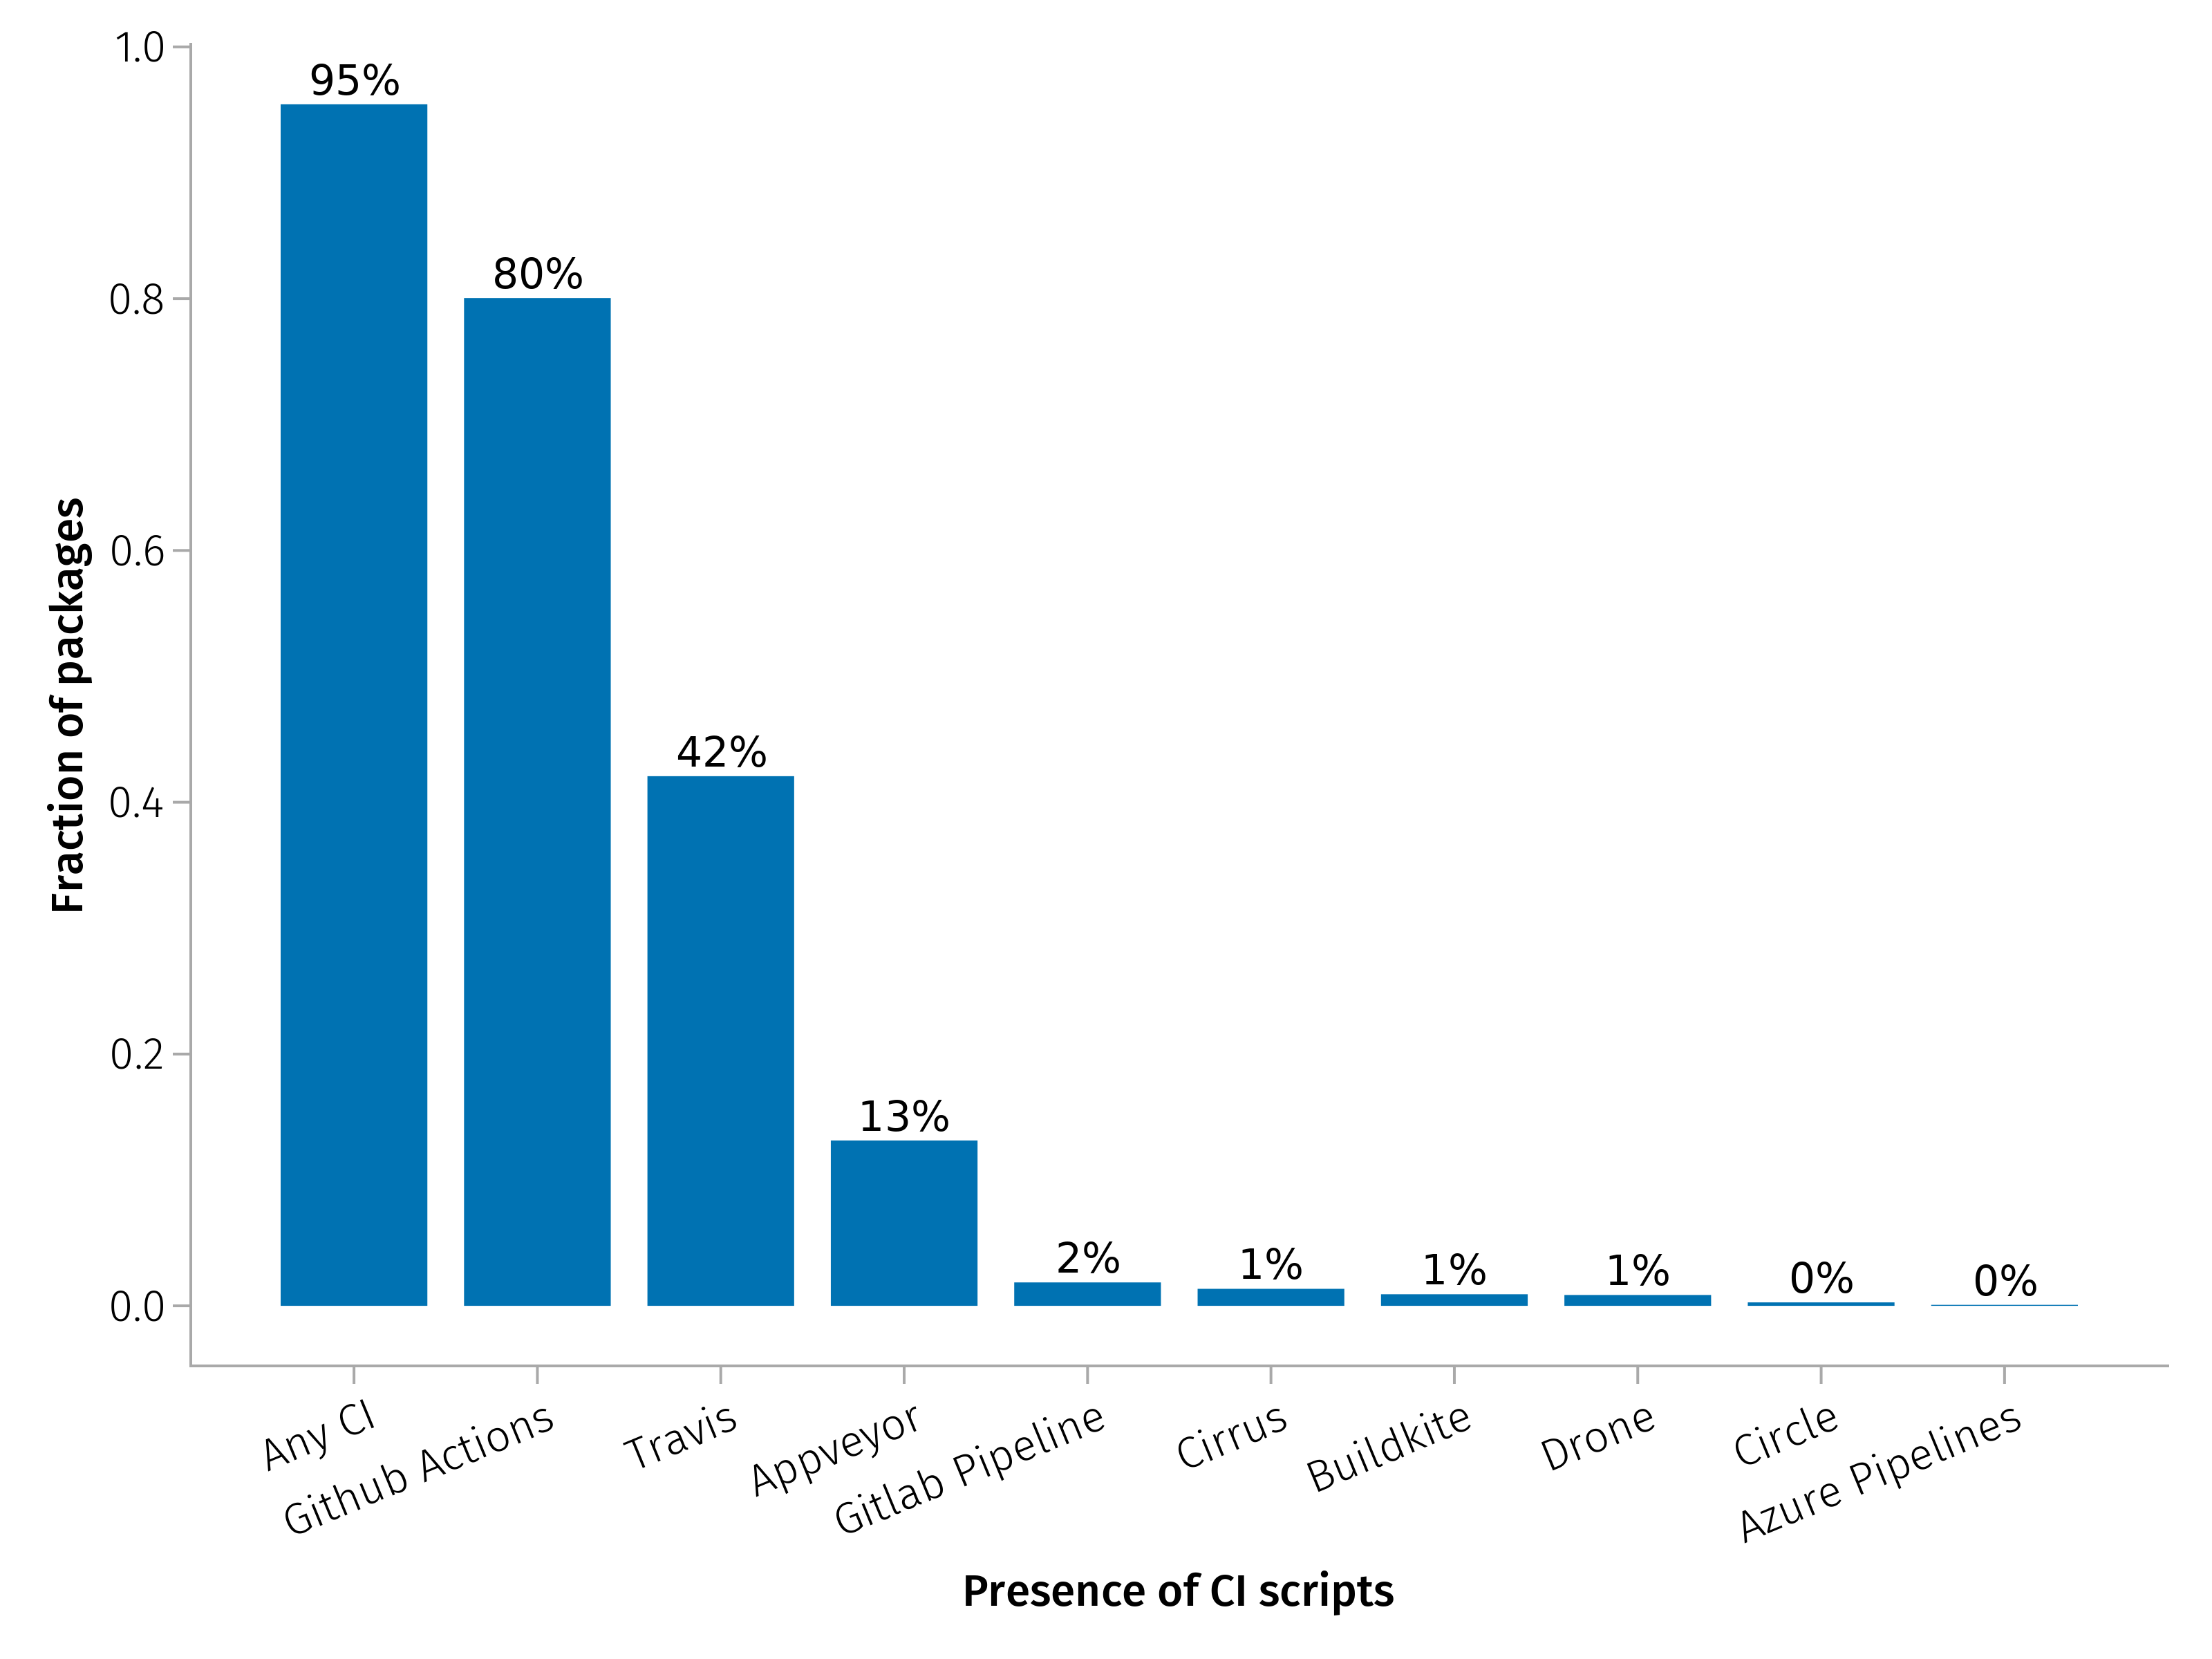
Julia users seem to love continuous integration (CI)! A staggering 95% of packages in the ecosystem are set up to use any continuous integration service, with GitHub Action being the most popular service (80%), followed by Travis (42%) and AppVeyor (13%).
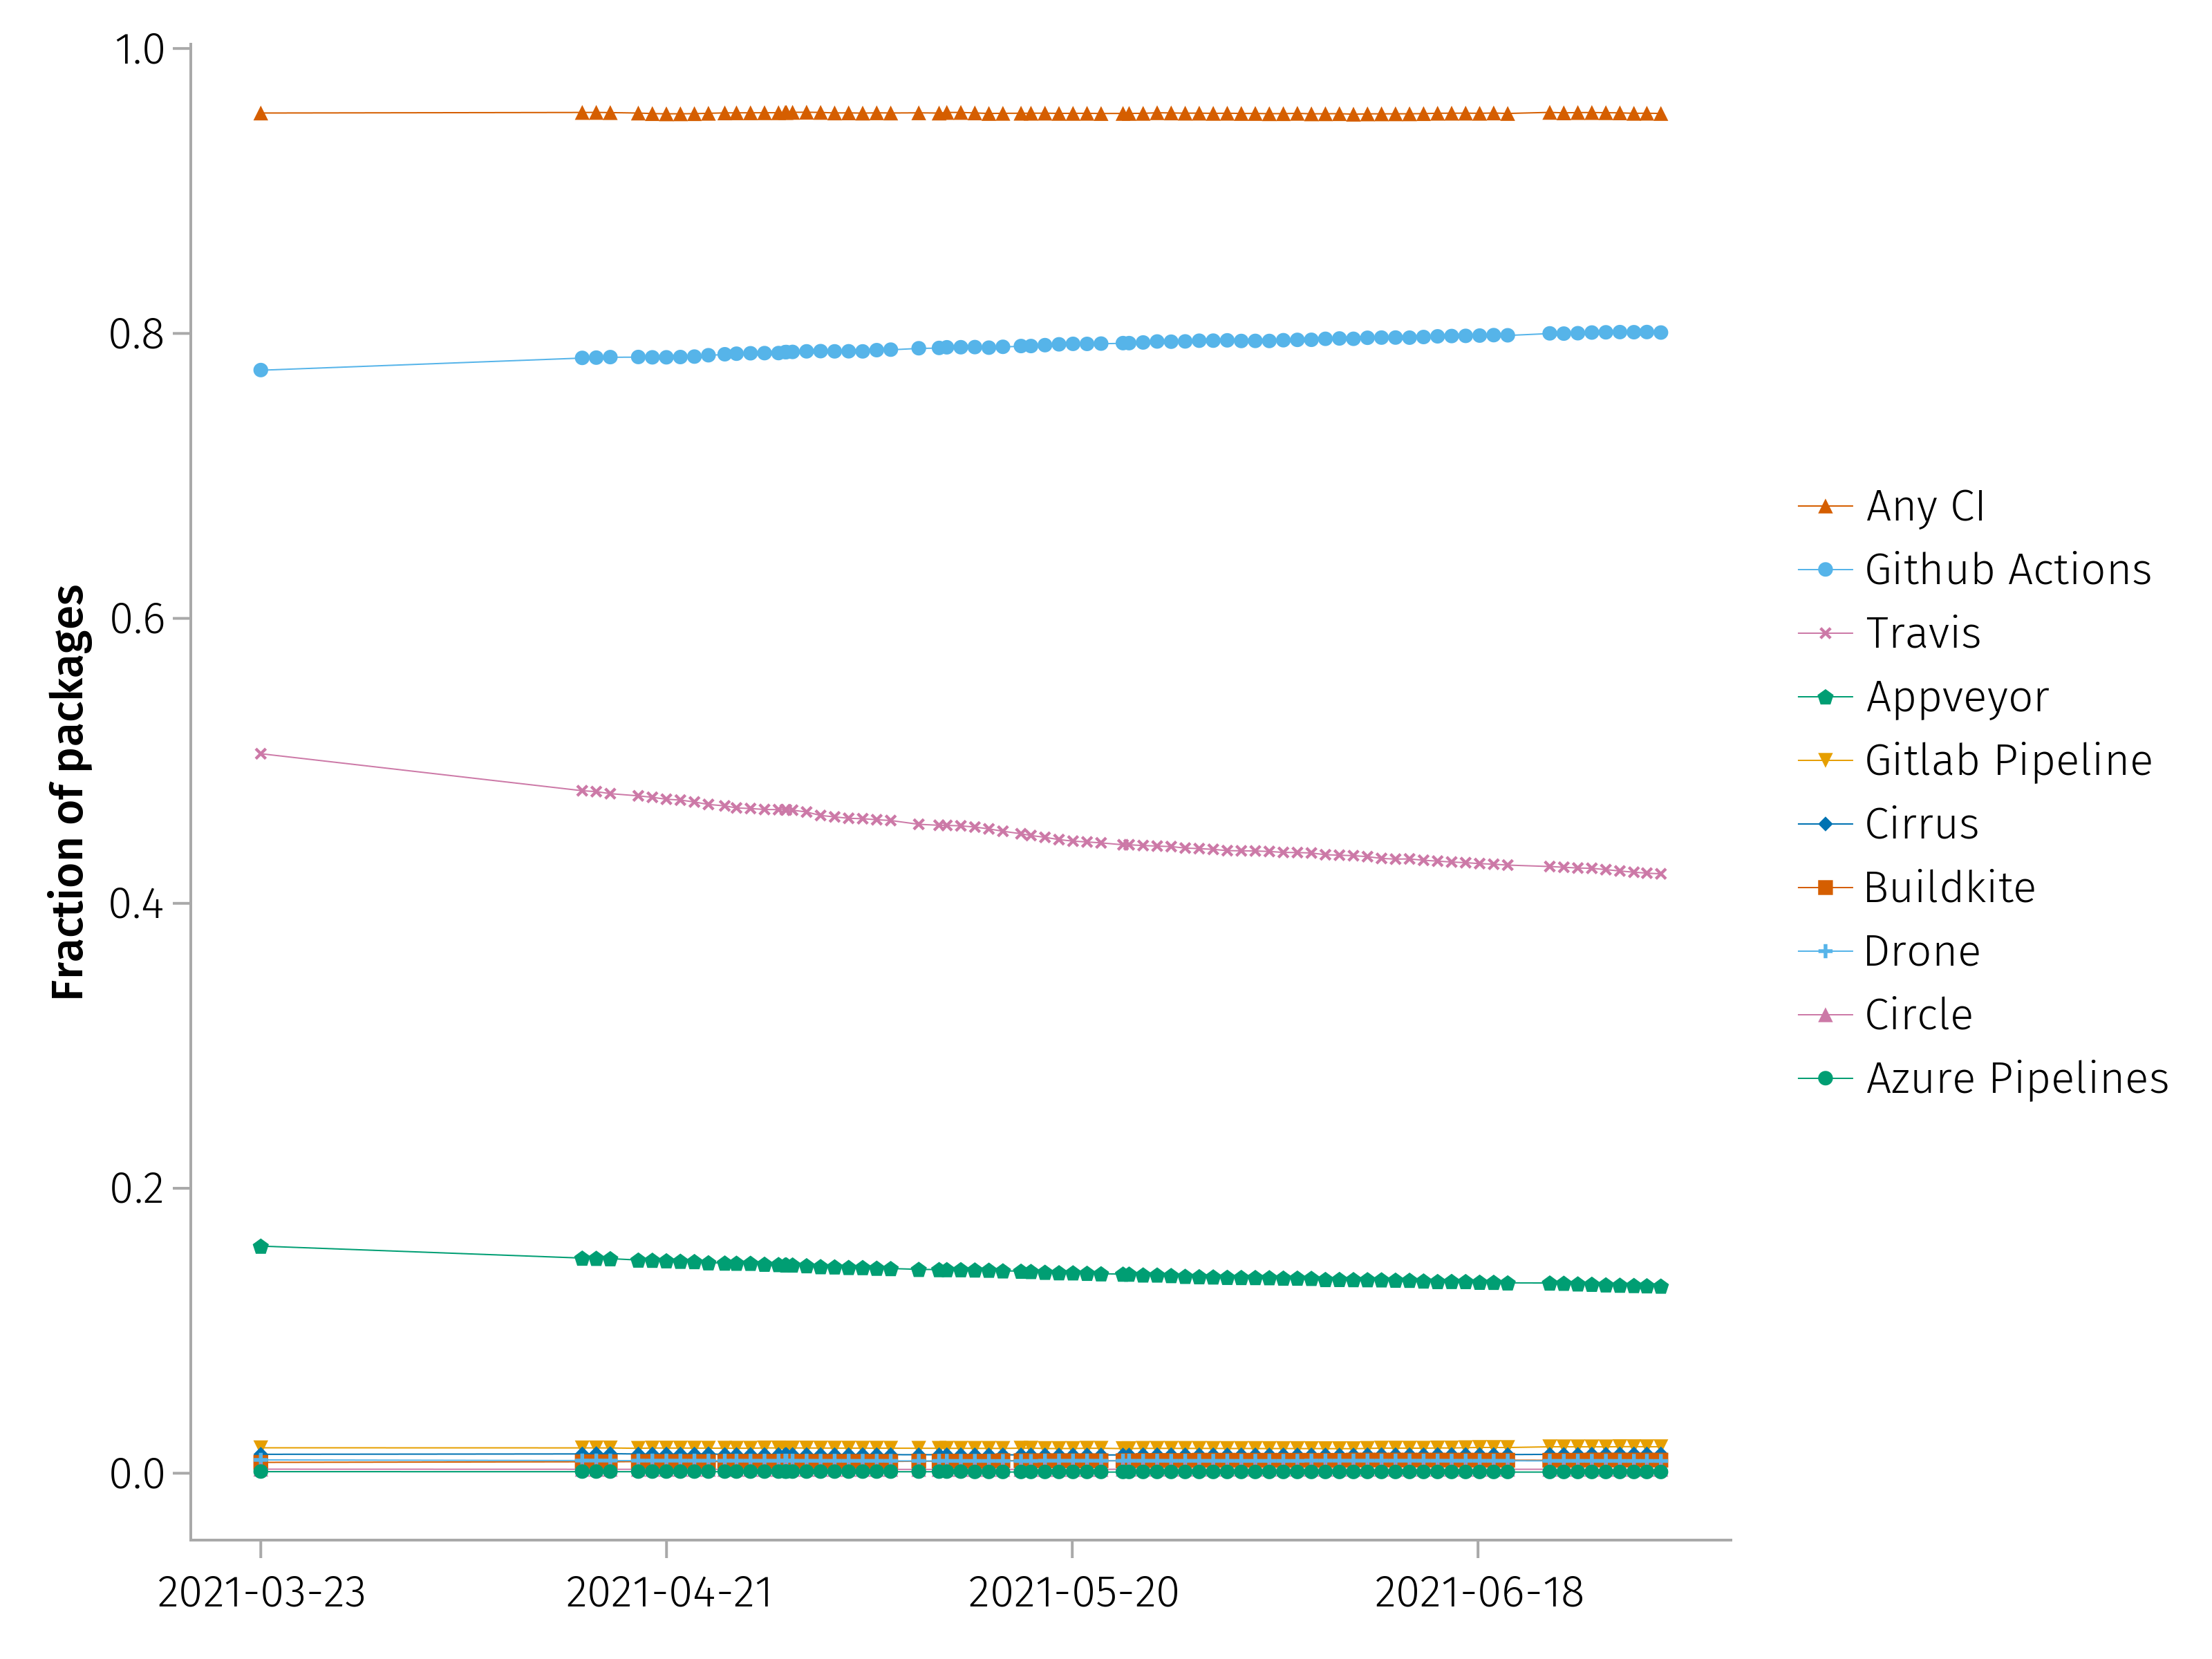
We can take a look at the popularity of CI services over time: a common trend is that GitHub Actions is taking over from Travis and Appveyor, which used to be the main choice for Julia users to test their packages on the most popular operating systems (Linux, macOS, Windows). The decreasing trend for Travis has been exacerbated last year when changes to their conditions made this service less favourable to be used by open-source projects.
Contributors
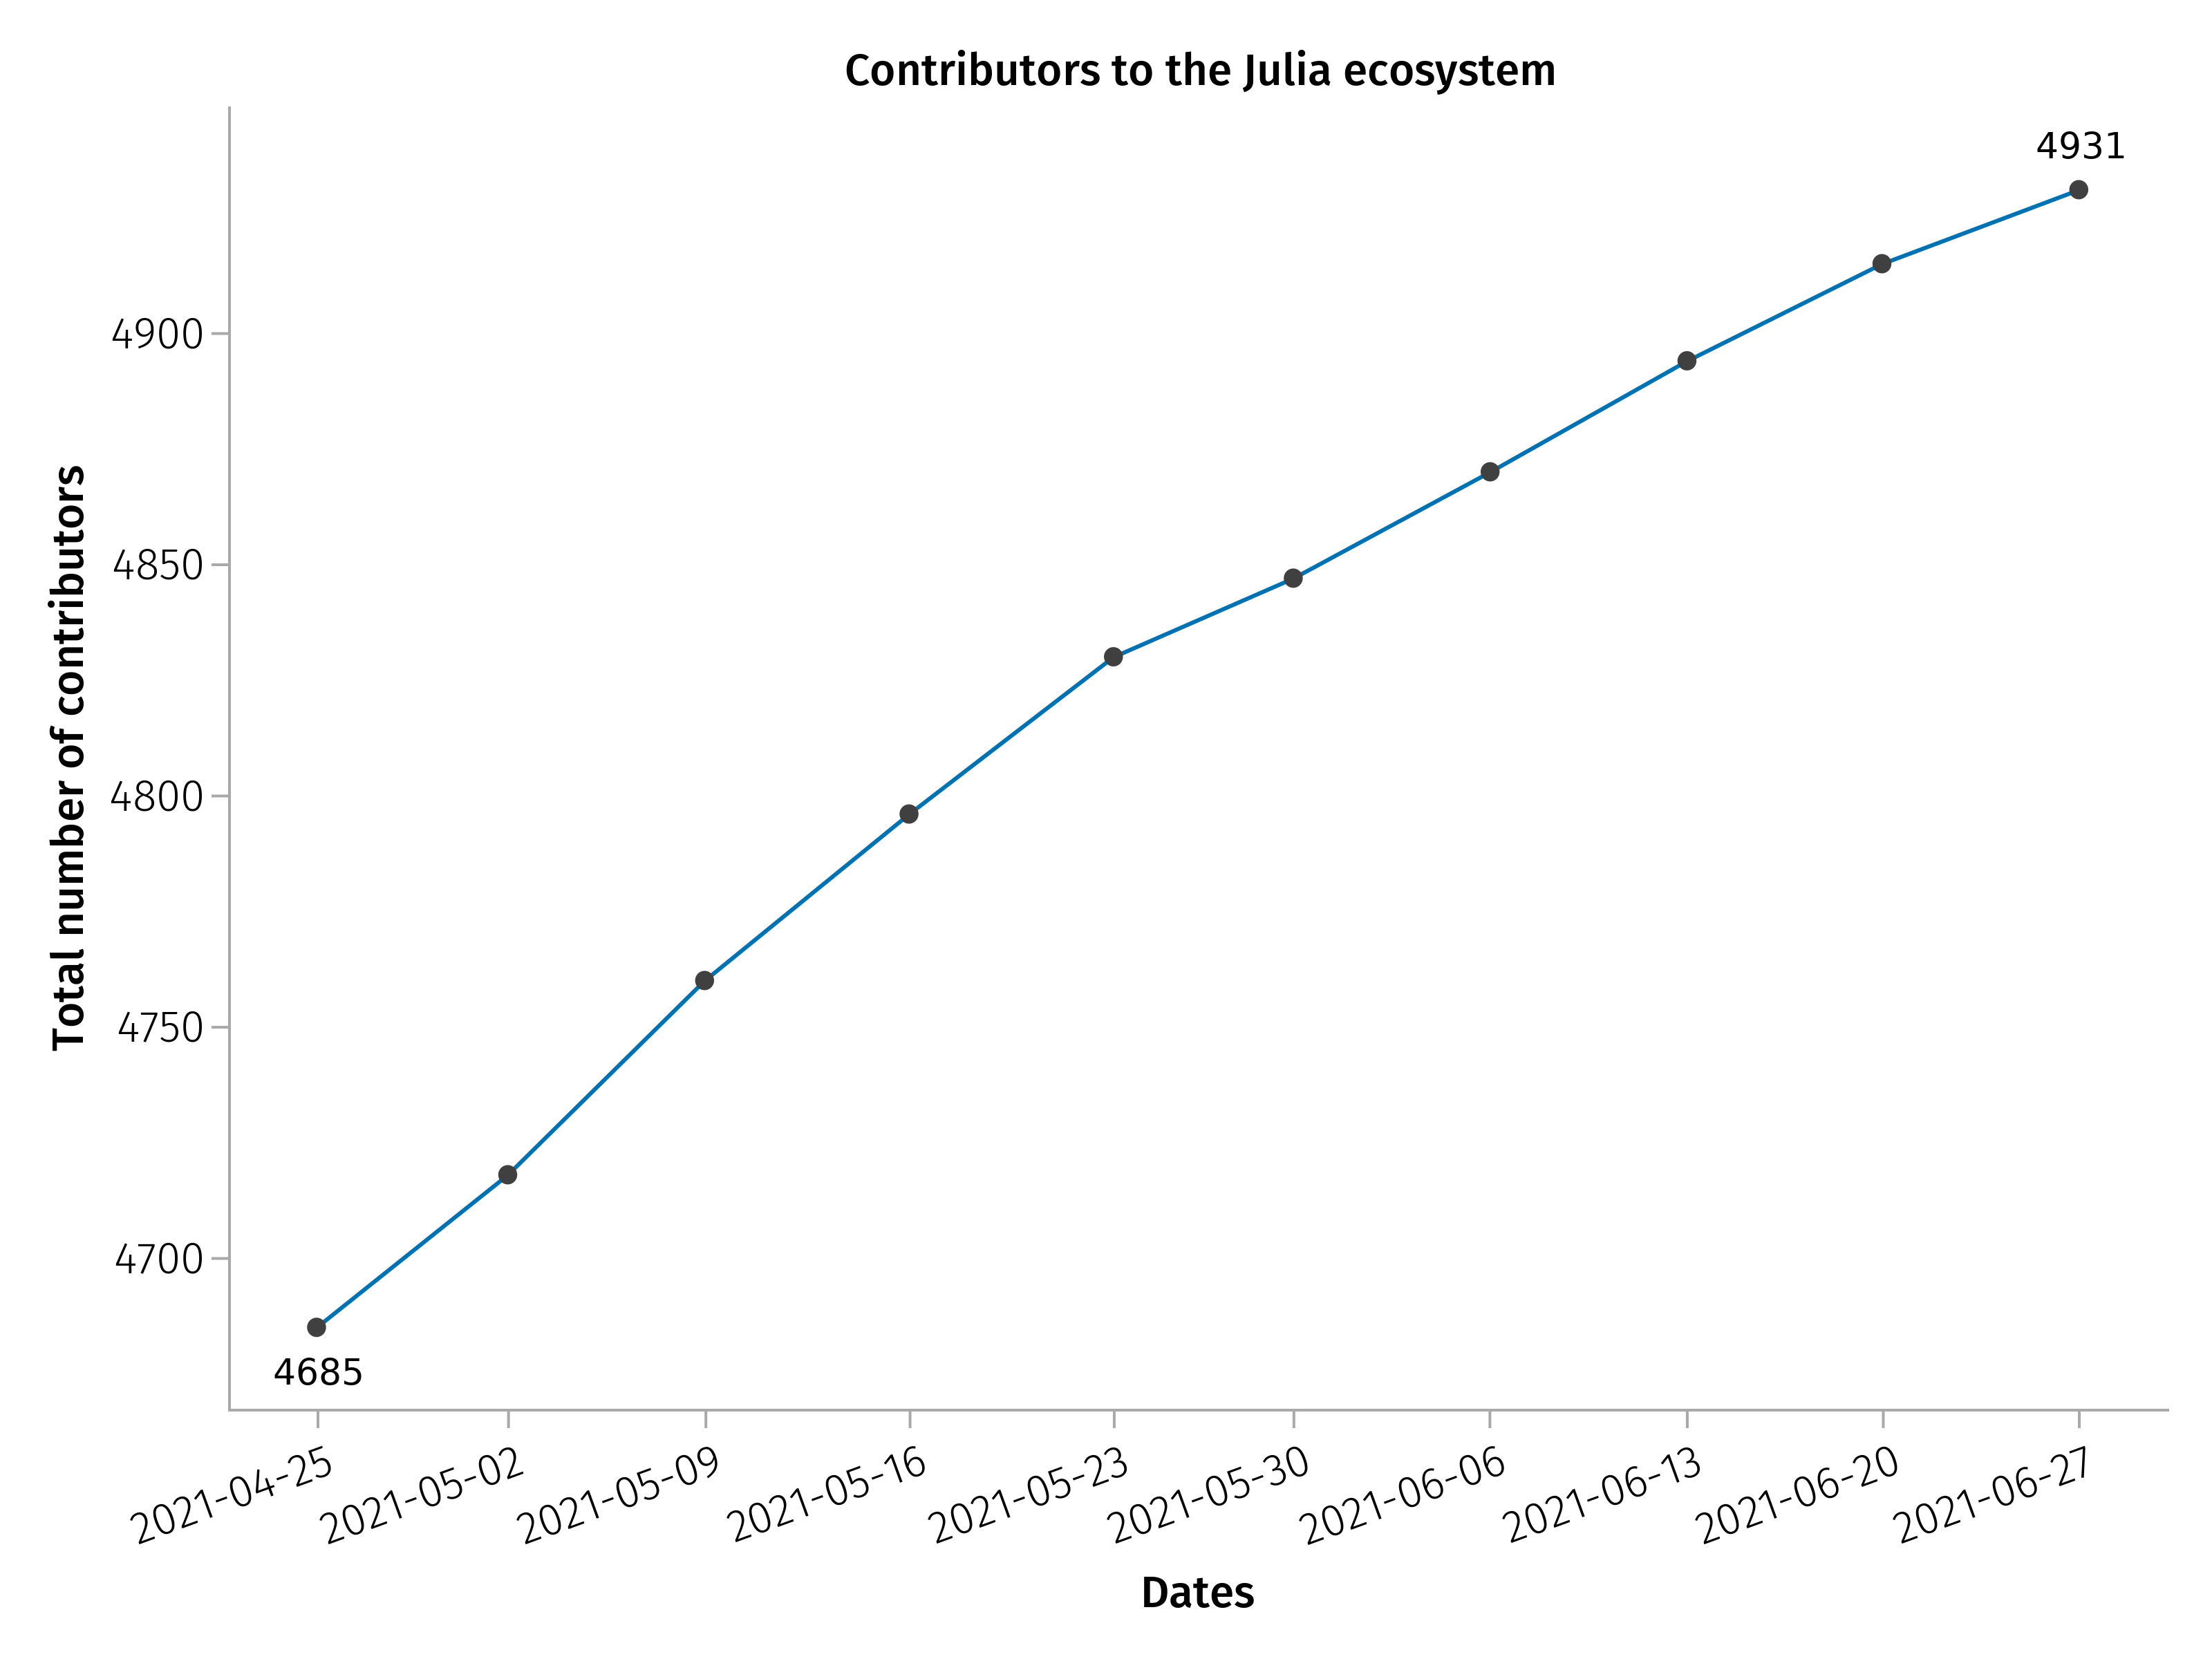
As of 2021-06-27, at least 4931 different users contributed to Julia packages hosted on GitHub, about 250 more compared to two months before. Note that these figures are conservative as they don't include contributors identified as anonymous by GitHub API (for example because they committed changes using an email address not registered in any GitHub account), or any contributions to packages hosted on different websites, like GitLab.
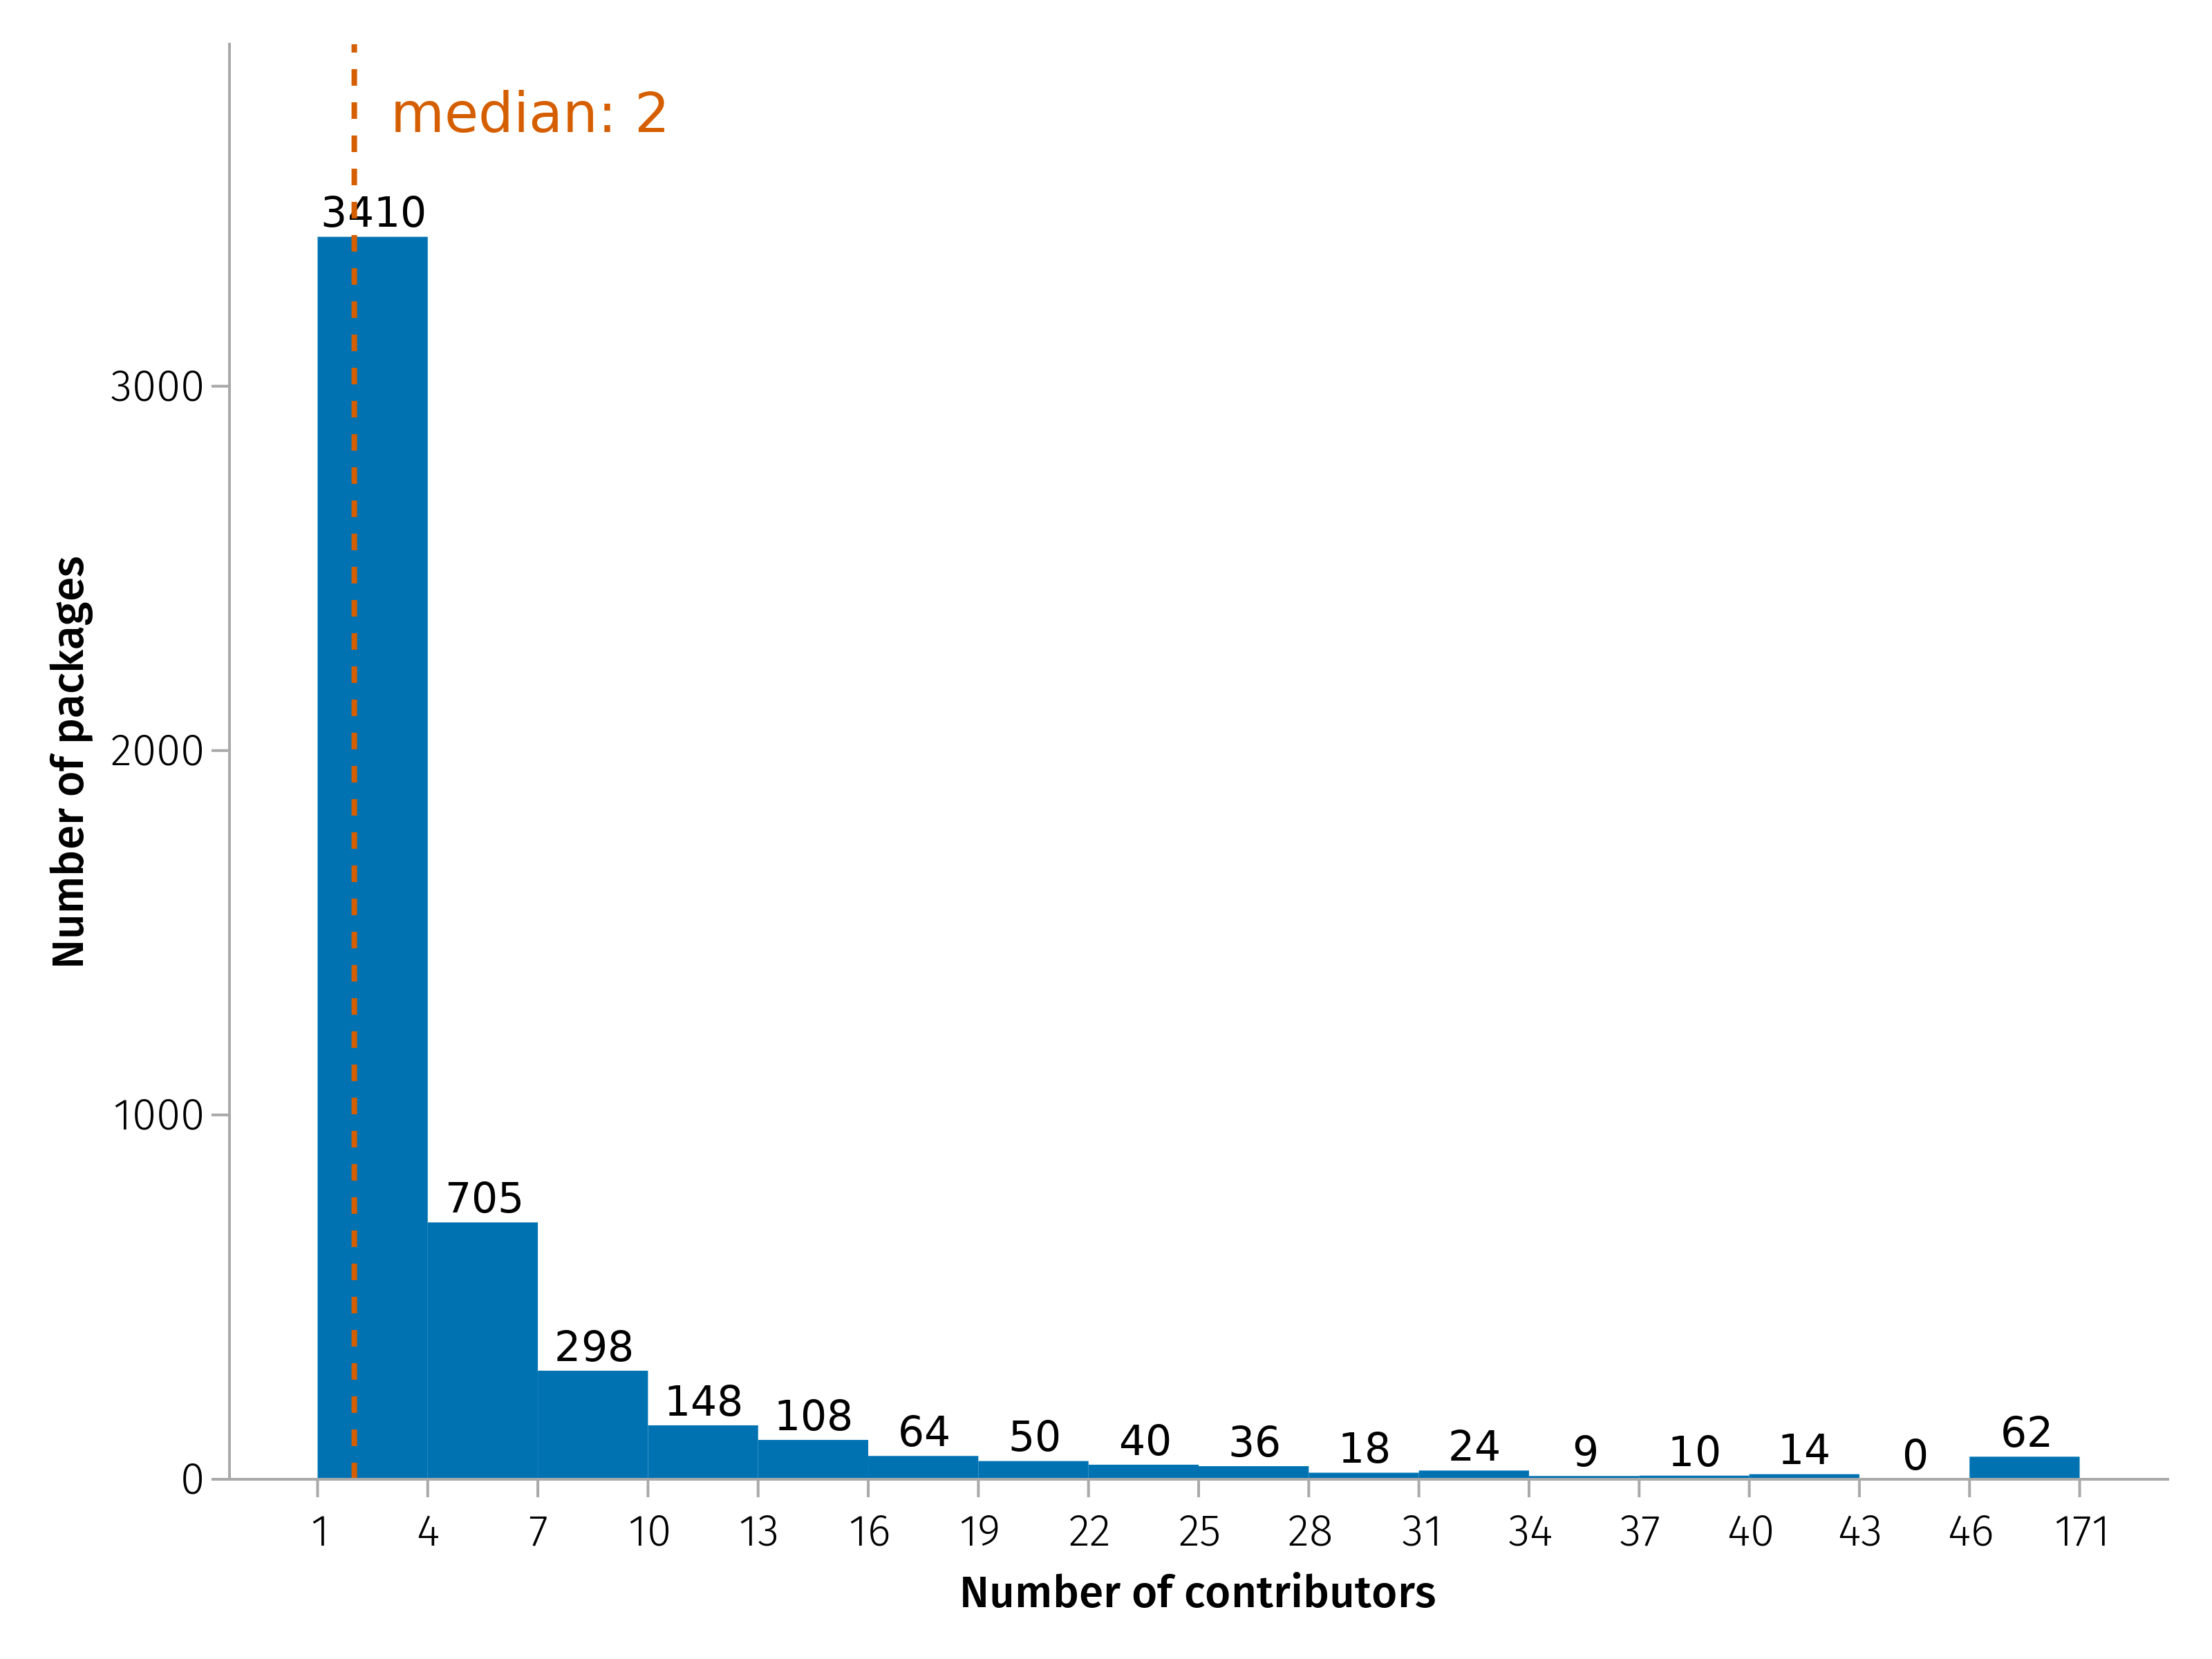
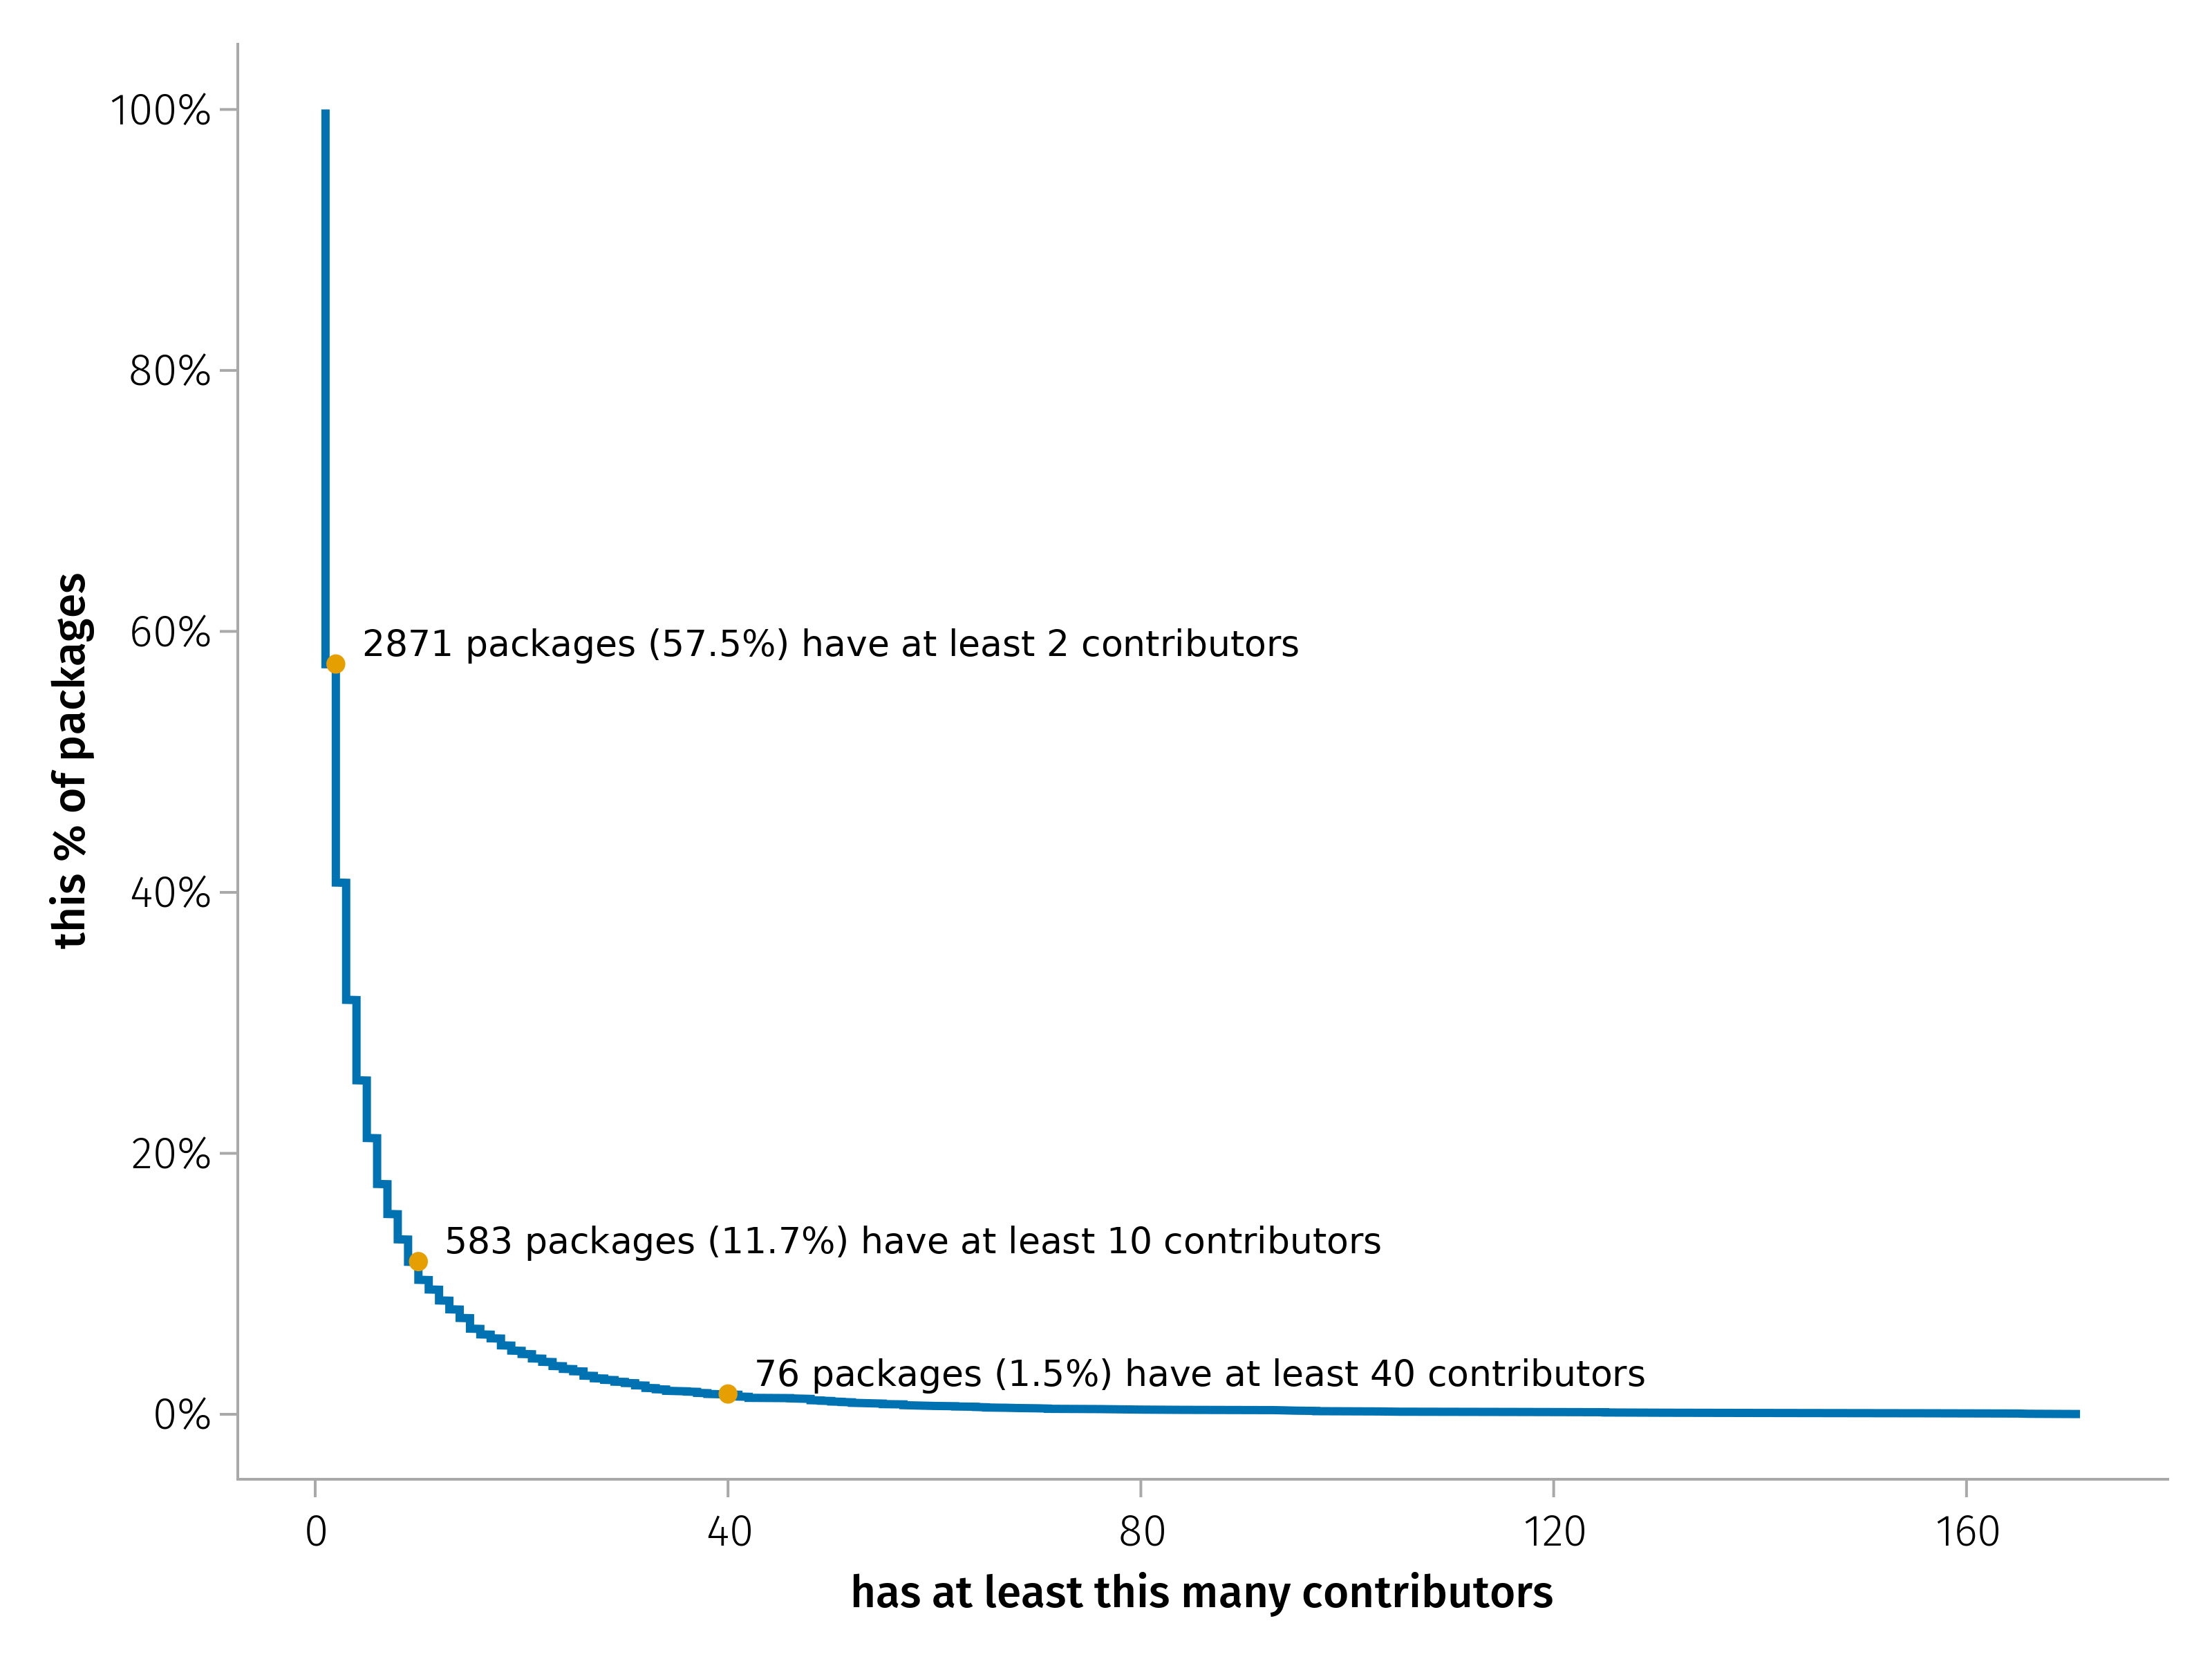
The distribution of number of contributors to Julia packages shows that the vast majority of packages have a handful of contributors, with a median of 2 contributors per package. Only about 11% of packages have more than 10 contributors, and about 1% have more than 40.
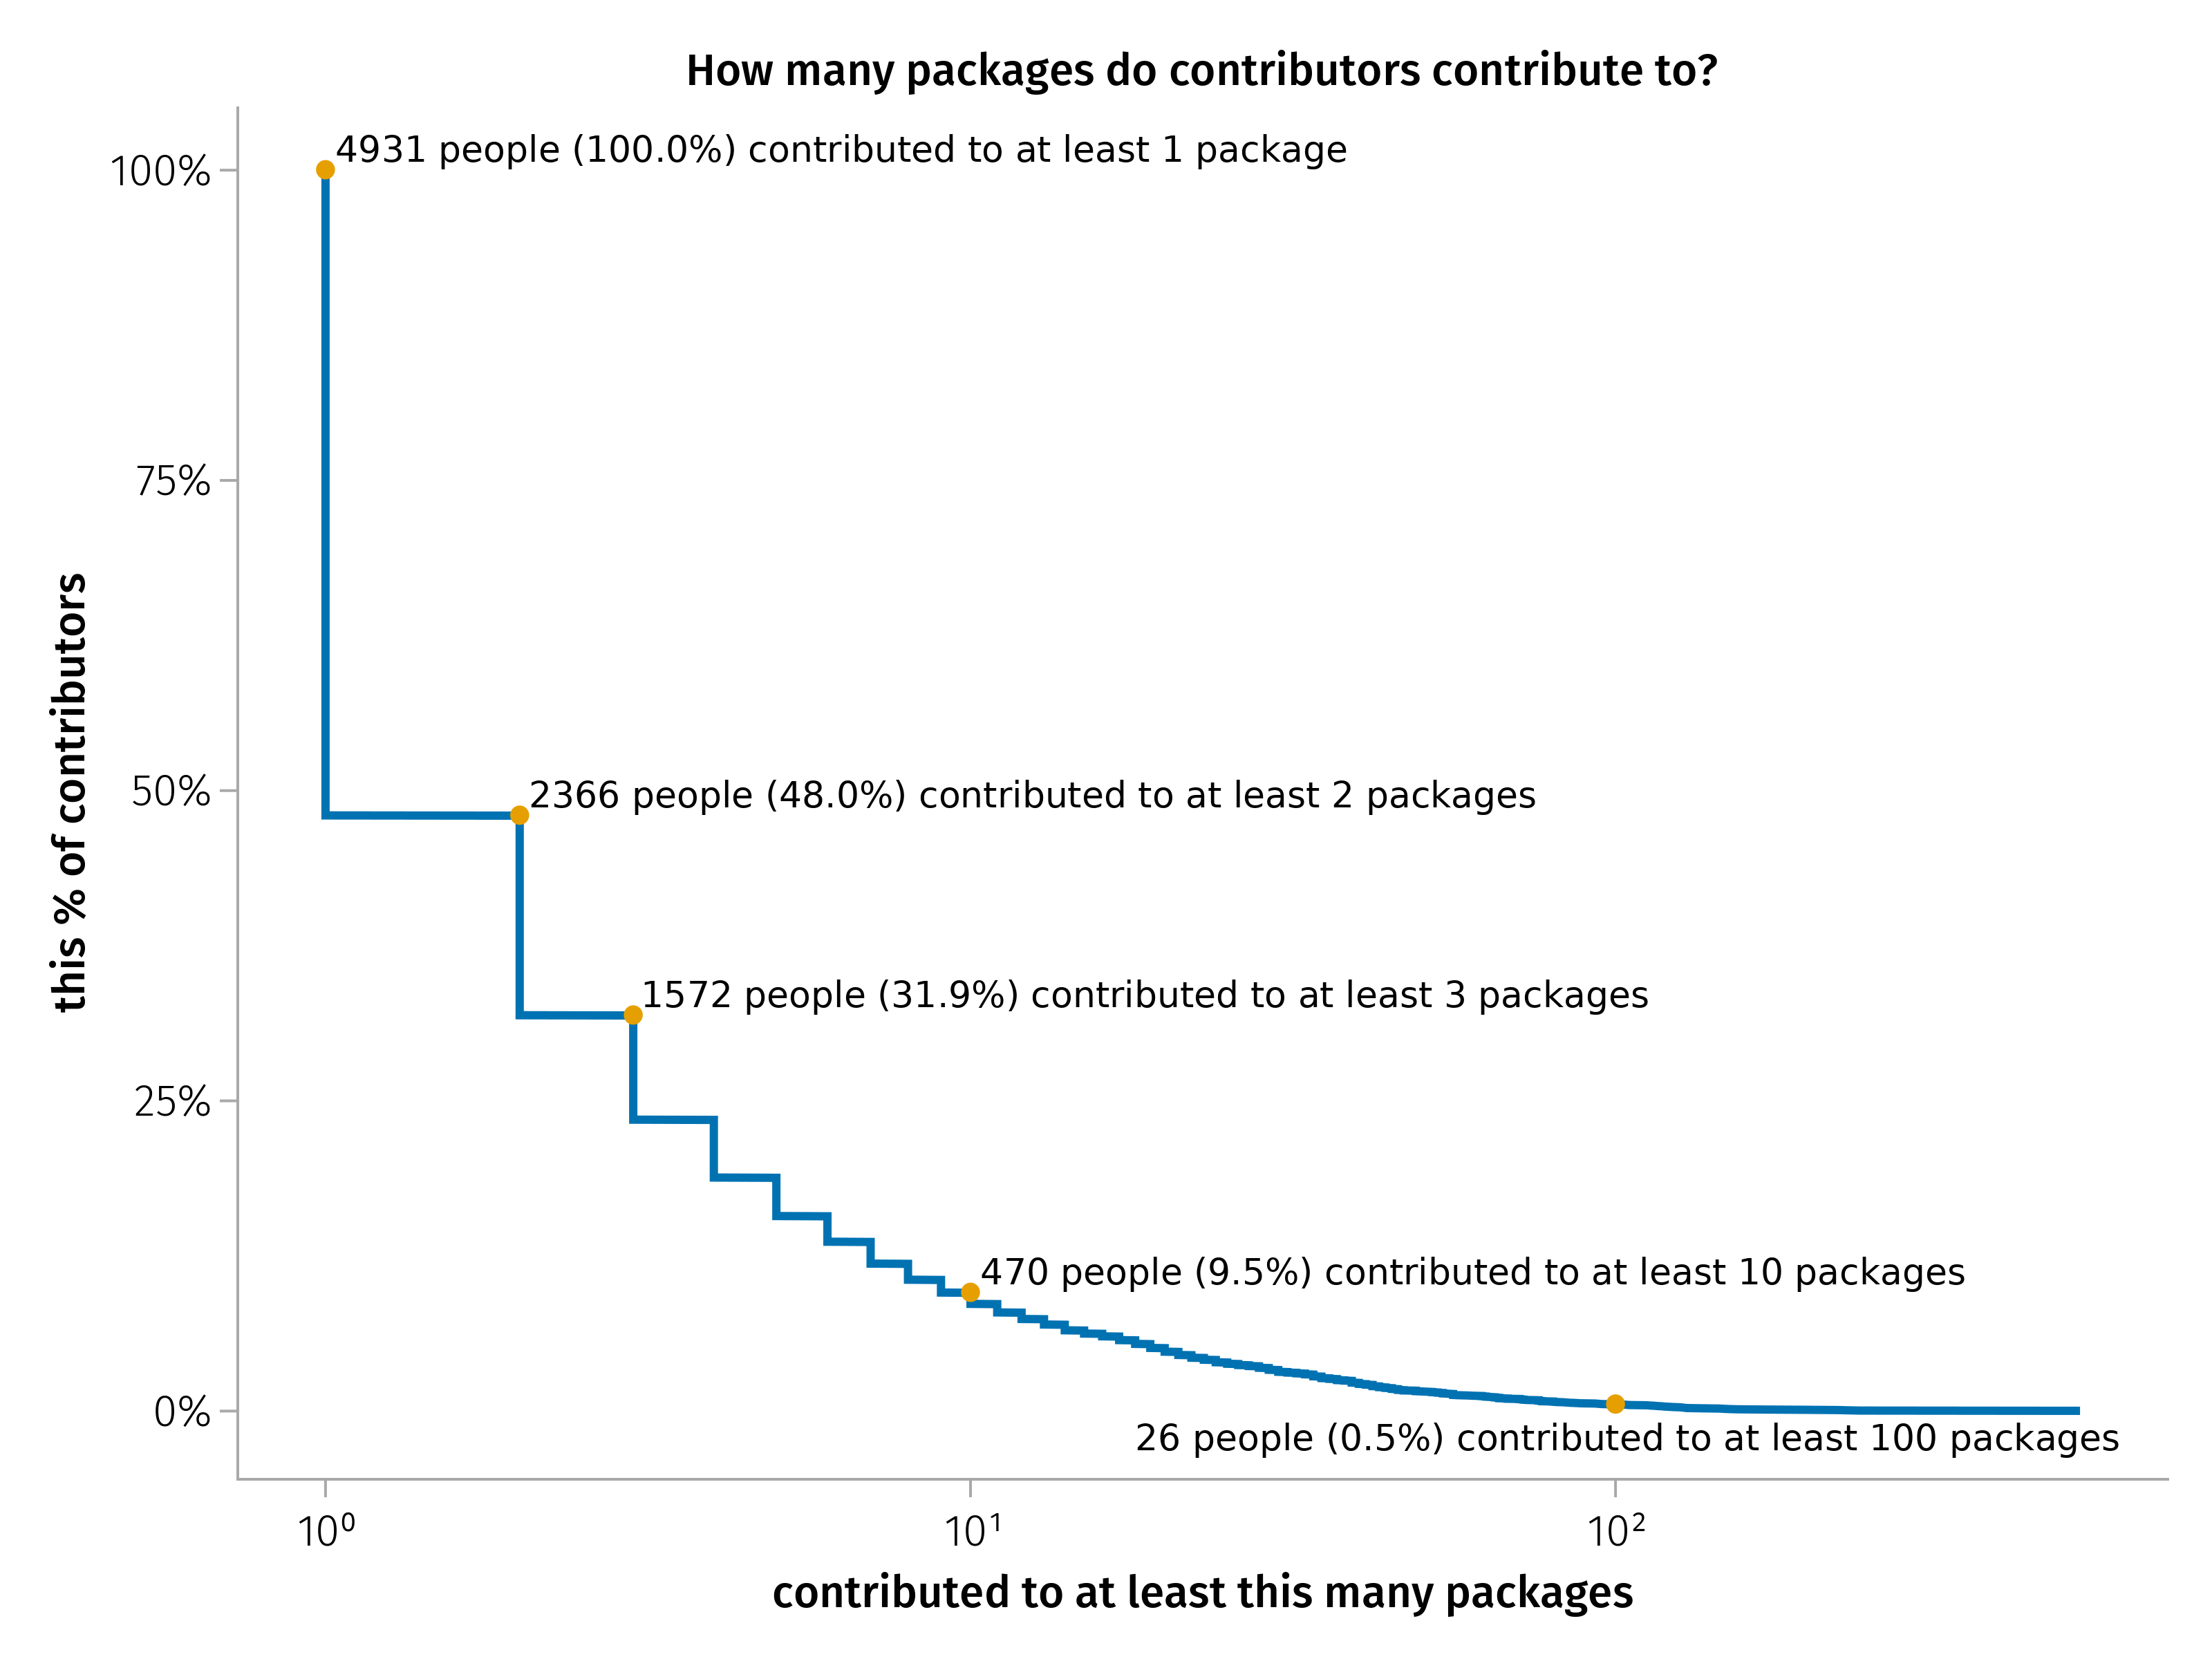
It's also interesting to see how likely Julia users are to contribute to multiple packages: 52% of users have contributed to a single package, a bit less than 10% contributed to at least 10 different packages, while 26 super active people contributed to more than 100 packages.
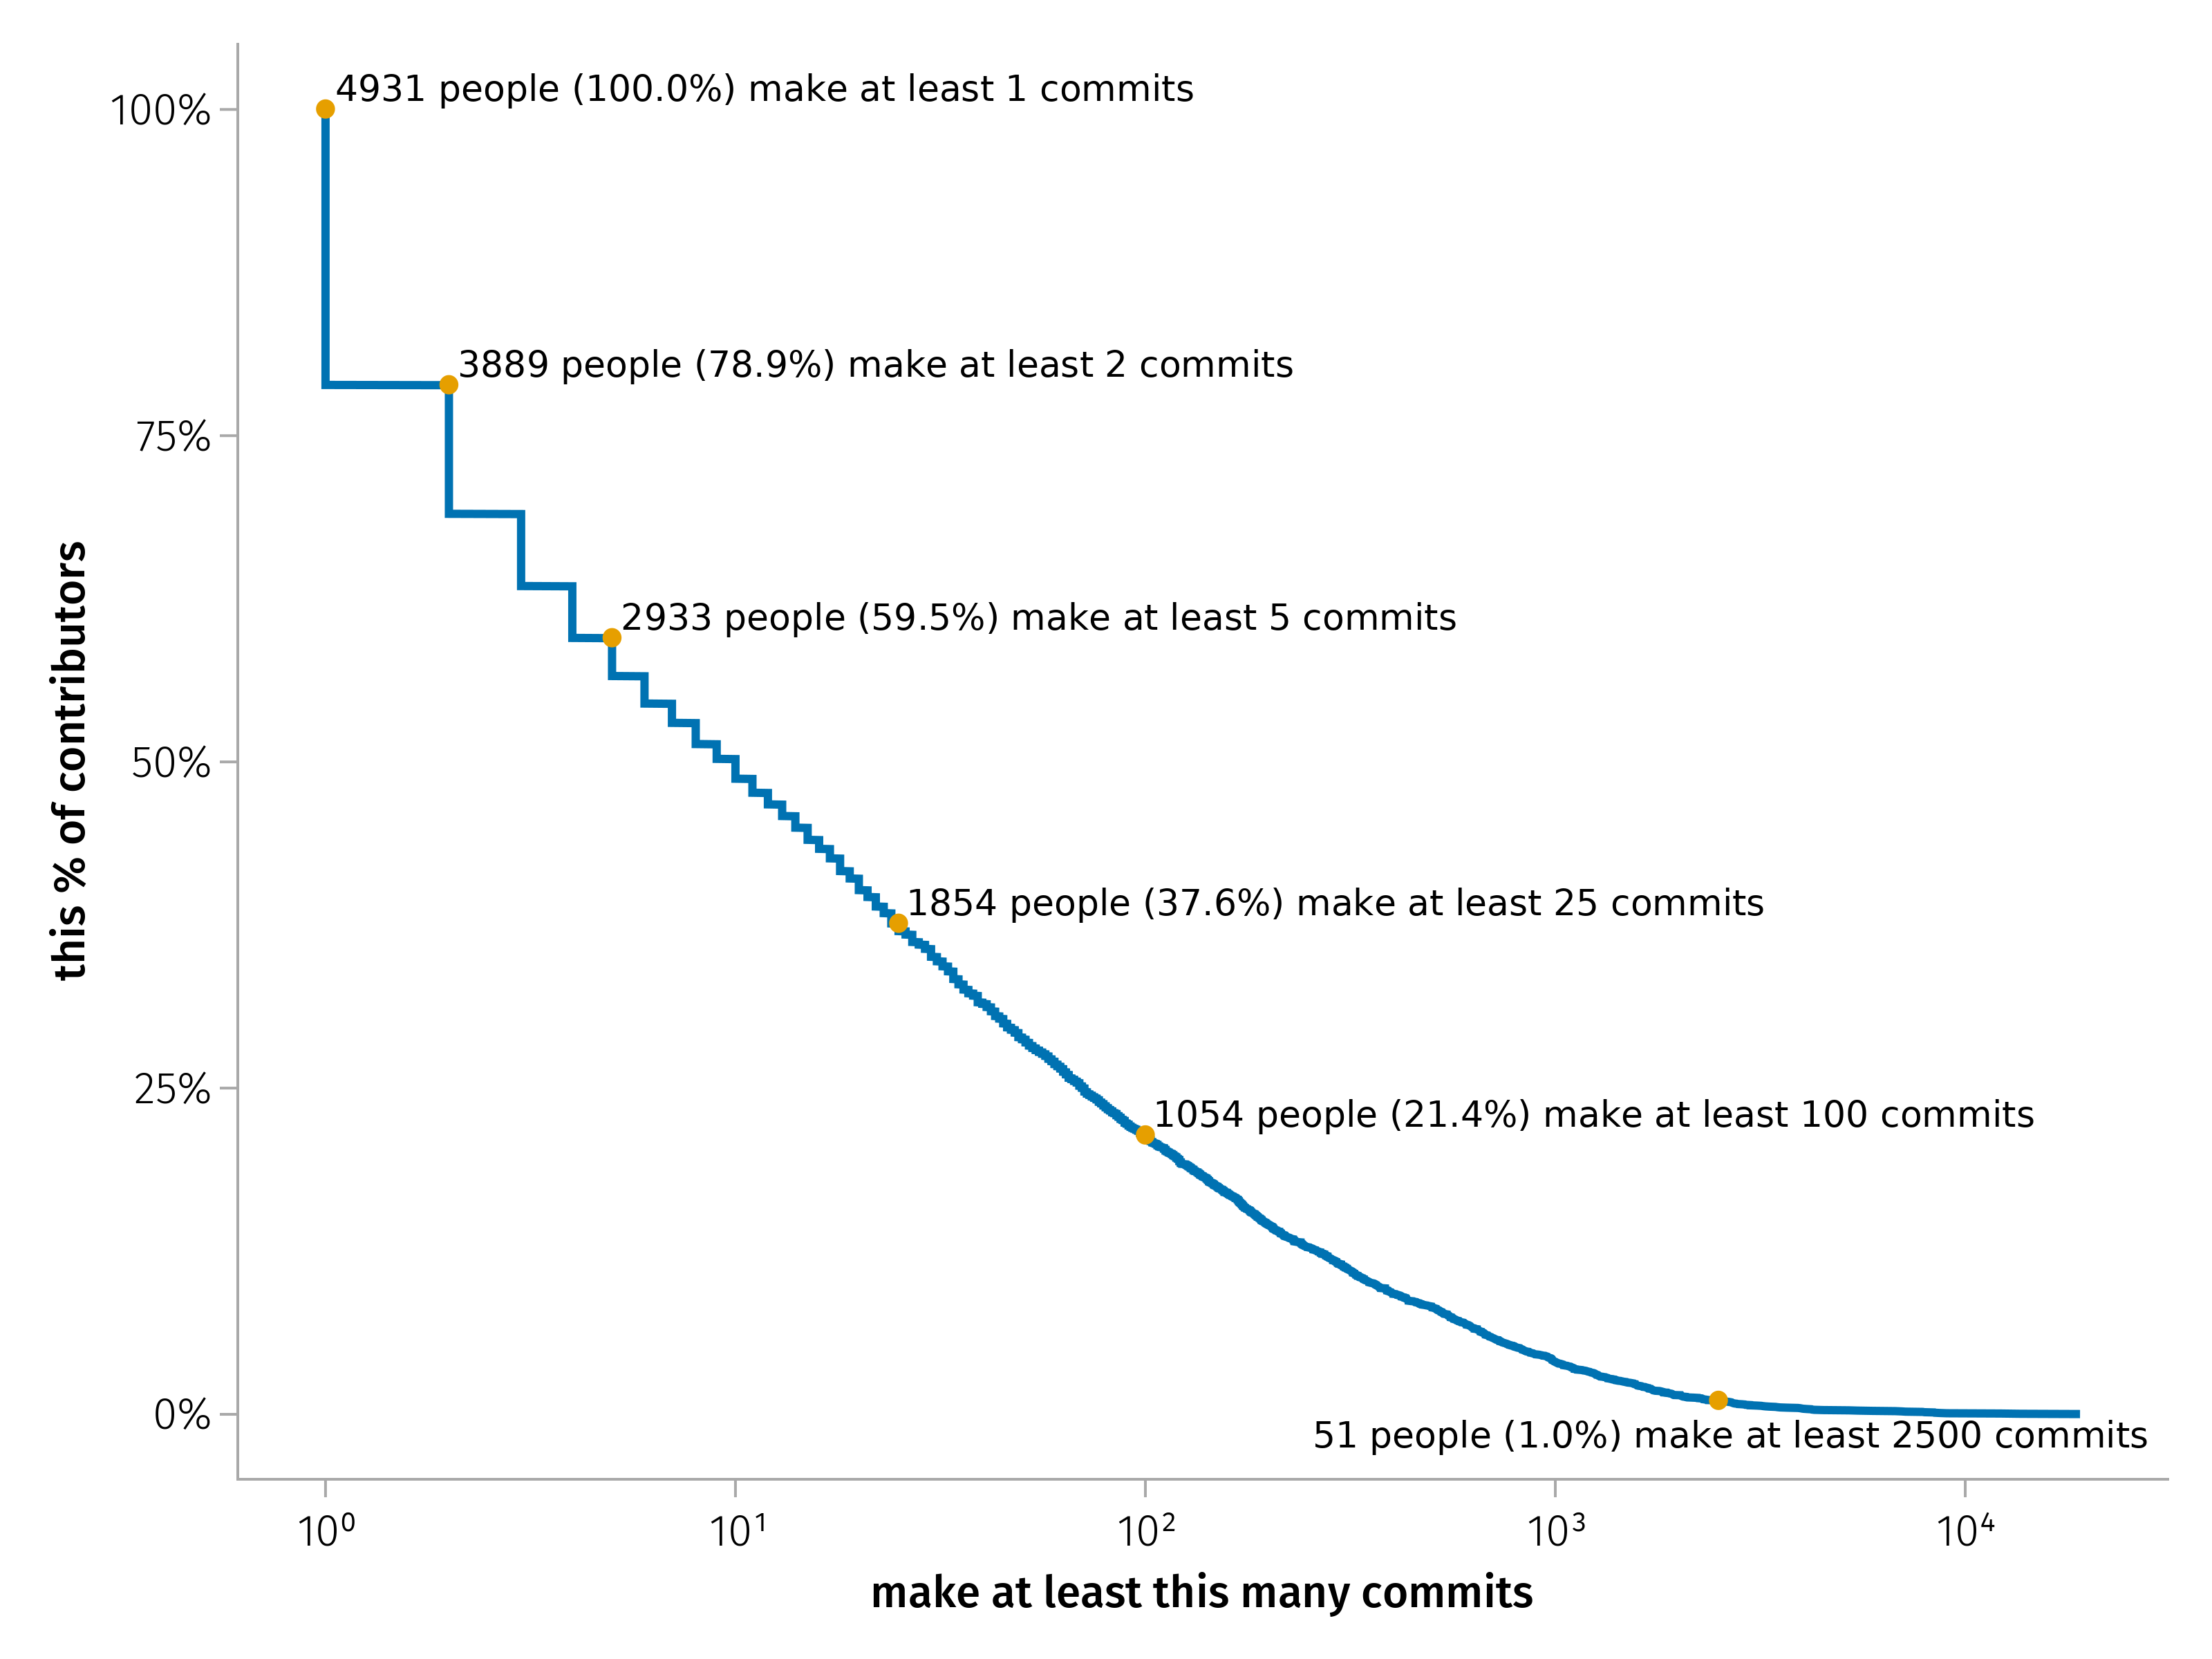
Finally, we looked at how many git commits users made: half of the community of the developers of Julia packages have at least 10 commits, 21% have at least 100 commits, while 51 people made more than 2500 commits.
Conclusions
Here are our main findings:
most packages do follow good programming practices (documentation, testing, continuous integration)! In particular:
high fraction of packages with any tests (96%), and at least 10% of code as tests (76%)
almost all packages have setup for continuous integration (95%)
documentation is not as popular; only 49% of packages have docs in the repository
most packages either have a README or docs (88% have at least twenty lines of one or the other)
in March 2021 the General registry started enforcing the presence of an OSI-approved license in order to register new packages or new versions: the fraction of packages with a license steadily increased since then (97%). Enforcing the rules work!
the median package has 507 lines of code, and the distribution looks log-normal
there are at least 4931 Julia users who contributed to registered packages on GitHub
most packages are developed by one or at most two developers: low bus factor!
a strong culture of collaboration is shown by the fact the repositories of 42% of packages on GitHub are part of organizations, so that multiple people have write access to them, instead of only their authors, which reduces the risk packages will be completely abandoned
583 packages have at least 10 contributors, while only 11 packages have more than 100
470 users contributed to at least 10 different packages, and 26 people have commits in at least 100 different packages
We want to highlight some caveats:
in our analysis we didn't count the over 700 registered JLL packages, as they are small automatically-generated packages, and aren't representative of the activity and practices of the Julia community
we didn't measure "quality", for example of documentation or testing, since it's also hard to sensibly define it, so we only counted number of lines, and looked at different distributions. One could suggest to use code coverage for testing, but that can't be done statically (you need to run the tests) and it isn't necessarily a good metric either: line code coverage doesn't take into account different code paths
similarly, we didn't check whether the continuous integration services were actually running. However, GitHub Actions is the most popular CI service used, and that's enabled by default on GitHub repositories. It's still remarkable that so many people decided to add the setup for CI, indicating they are aware of this possibility: if you compare the 95% of Julia packages with setup for CI with the results of this analysis by Jamie Quinn, who found that only about 20% of software published in the Journal of Open Source Software appear to have the setup for some CI services, the difference is stark.
If you have any other metrics about the ecosystem you believe it would be interesting to collect, please get in touch for example by opening an issue in the PackageAnalyzer.jl repository.